IN THE PAST FEW YEARS, TRIMBLE’S SketchUp application has been on a tear with new features and technologies. We last did a product review of SketchUp Studio for the 2020 release. We talk to Andrew Corney, Product Director, Architecture and Design Division, SketchUp, about the PreDesign features in this in-depth feature.
Since our last look, Trimble has modified SketchUp’s product offerings. SketchUp Studio—SketchUp Pro with Sefaria features and technologies included—no longer exists as a product. Sefaira is back to being a separate product. And to make things more interesting, Trimble has developed PreDesign as a set of climate-responsive design technologies packaged into a web app that comes with SketchUp Pro licenses.
MORE: Product Review: Trimble SketchUp Studio 2020
PreDesign operates at an entirely different level than Sefaira. It does not technically work on your SketchUp models or use them in any way in its generative data and calculations.
Why PreDesign
One reason Trimble developed PreDesign is to bring climate science down to the level of the average architectural practice. While tech-forward and large firms use Sefaira’s technically advanced (but complex) tools, most architects need a more uncomplicated pathway to implement climate-responsive design strategies in their day-to-day work.
“What we observed is that in talking to architects and watching them start their projects, there wasn’t much research at the start as we had expected,” says Andrew Corney, who formally was Product Director for Sefaira. “We were quite surprised at how many designers immediately start doing design in 3D in SketchUp and how they didn’t have the tools available to do some basic consideration of climate and how it affects their buildings.”
What we observed is that in talking to architects and watching them start their projects, there wasn’t much research at the start as we had expected.
Corney noted that if one looks at the top ten AIA winning projects, one will find all kinds of energy-related data, wind roses, and similar charts. Still, in talking to actual designers, you soon find out the designs can have less connection to the data than imagined. “Drawing the dots between what the charts are telling you and what the design is about was missing,” says Corney.
Trimble saw an opportunity to fix this. More than that, they felt there was an opportunity to provide a low-barrier entryway to bringing climate science into the design process in SketchUp and draw the dots for them since architects weren’t doing this or thinking about it.
Initial Failures
Sefaira was already a tool that the average architect didn’t feel technically capable of managing. Specialists and larger firms have staff with building science degrees, sustainable design degrees, and computational-design degrees. These folks are naturals for Sefaira’s vast power and more complex user interface.
In Trimble’s earliest attempts at PreDesign, they started with a much more technical product, but not as technical as Sefaira. The beta group of over 100 architects found it challenging. “In the first round of feedback, people were saying things like ‘this is too complicated,’ ‘this is too scientific,’ or ‘it doesn’t feel like me,’ ” says Corney.
It was also important that PreDesign wasn’t forcing the architect to go down a particular path.
“So in the second round, we realized we needed to visualize solutions more, and in a way that is non-specific and can be applied to any project,” says Corney. “It was also important that PreDesign wasn’t forcing the architect to go down a particular path.”
Continuing to work with the beta group, Trimble eventually arrived at the PreDesign application we have in front of us today.
In-Depth with PreDesign
PreDesign is a free web application included with a SketchUp Pro license. You access the web application from SketchUp Pro via a menu selection, or you can launch it from the web browser if you are logged into your Trimble account online.
Corney says that most architects want to understand a given environment and its potential impacts on a building at the early stage of design. And yet he says, “I think the experiential is what architects are more familiar with talking about; they are not so familiar with talking about BTUs…but rather in terms of helping them tell the story they would normally be telling but with an environmental data backup.”
To walk you through PreDesign, we will create a new study ourselves.
SketchUp’s PreDesign features are not actually inside of SketchUp the application. However, that is how you begin when you go to the menu File > Start PreDesign. The PreDesign application will then pop up in a web browser window with three Demo Studies shown and a button labeled “Create new study.” A help button popup also links to the PreDesign Forum, Guides, and other items.
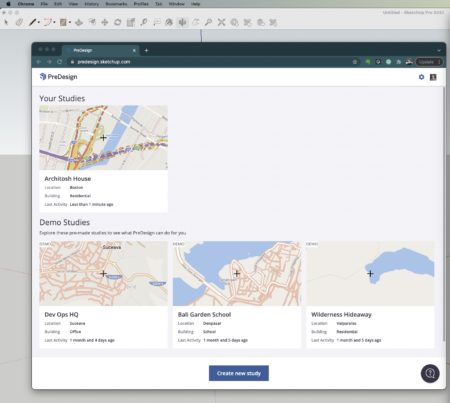
Initiating a study in PreDesign is rather straightforward. The primary goal is locating your site and selecting your source for weather data.
For this review, we will select to create a new study. Options for studies include Office, School, or Residential. The process begins with locating your project on Earth. I have typed in Boston, Massachusetts. The weather data source can be based on Satellite or Weather Station. If you select the Weather Station button, a drop-down provides you with a list of all nearby weather stations. I have chosen Lawrence Municipal AP, which is in the historic industrial city of Lawrence. Upon selecting the location, a study is created and listed on the PreDesign home page. Once you click on your study (in my case Architosh House – Boston), SketchUp PreDesign generates an analysis. (see image).
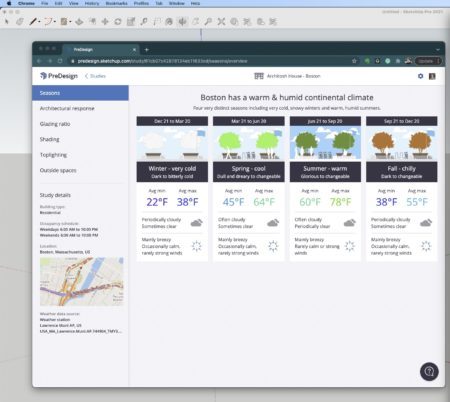
Boston has a warm and humid continental climate. Here are the four seasons described per environmental characteristics with temperature ranges.
As you can see from the image above, Boston has four very distinct seasons, from humid summers to very cold snowy winters. Average minimum and average maximum temperatures for each season are indicated.
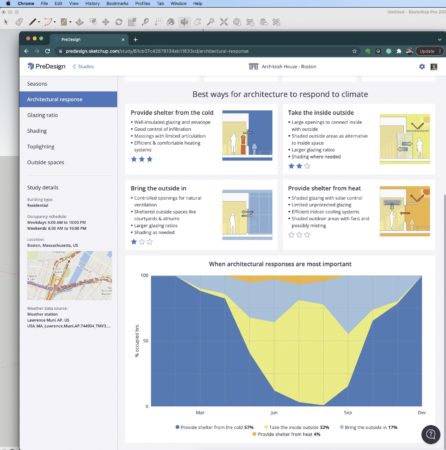
The goal is to use the following generated analysis data to help design your project to be responsive to climate science data and optimized for human comfort. There are five major areas the program walks the user through, including Architectural Response, Glazing Ratio, Shading, Toplighting, and Outdoor Spaces. Each season has information on design guidelines for how the architect can adapt the design strategies to increase human comfort and respond to the local climate.
For example, in Boston’s spring season, people want to be outside, and the frequency of occupation for this project type falls to 24 percent versus 57 percent during the winter. Most humans will want to be outside to enjoy the spring weather. Architectural guidance includes ways to “take the inside outside” via the use of large openings to connect to outside areas, large glazing ratios, and shading where needed. At the same time, winter season guidance suggests massing with limited articulation (e.g., think New England colonial houses, which are basic rectangles). An occupation hours percentage chart indicates when architectural responses are most important.
The next section is Glazing Ratios. An analysis is run and produces a calculation of heat loss potential measured in heating-degree days per year and an overheating from sun value measured in overheating hours per year.
We have 3,208 heating degree-days per year in heat loss potential in the Boston metro region. Heat loss through glazing is determined as “high,” as is the impact on glazing ratios. As you toggle between different orientations (north, south, east, southwest, etc.), the effects of the sun on overheating due to glazing is determined for you. In the south orientation, heat gain through glazing is rated as “quite significant,” but the impact on the glazing ratio is rated as “moderate.” Whereas, for the southwest orientation, the effect on the glazing ratio is rated as “high.” Hours of overheating per year are calculated for each orientation.
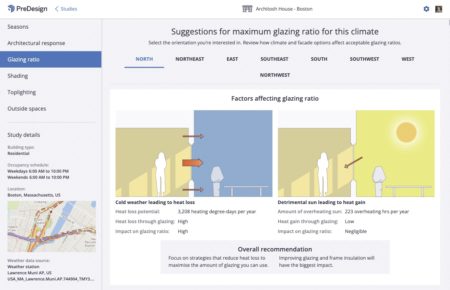
Potential heat loss through glazing and detrimental heat gain in the summer months via glazing is calculated in this section. The lower part of this section runs through dozens of glazing strategies in technical detail.
The rest of this particular section focuses on providing strategies around glazing, showing an optimal vs. typical strategy situation with an extensive range of optional strategies broken down by filter selections. To help the architect make the best decisions regarding glazing, the filters allow the user to toggle through different combinations of filter selections, including glazing insulation value, glazing frame material, glazing solar control quality values, and exterior shading options.
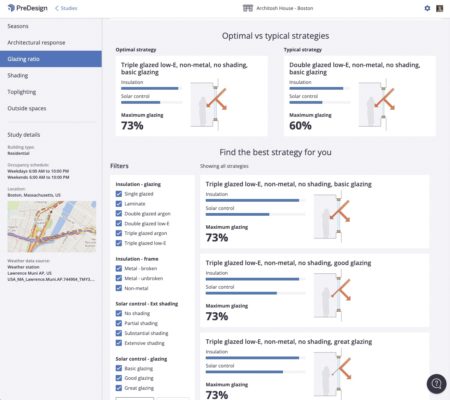
Optimal versus typical glazing strategies and resultant max glazing ratio. The lower section contains filters on glazing assemblies (systems) to build various options and have the software generate maximum glazing percentages under those configurations. This is section is incredibly useful for designing energy-efficient buildings.
For a Triple glazed, low-E, non-metal, no shading but great glazing solar control glass, maximum glazing ratios are as high as 73 percent. Adding partial shading—which would be beneficial in summer—is of less value as maximum glazing is still limited to 73 percent. Dropping out the low-E component but keeping the argon fill for triple-glazed glazing limits maximum glazing to 57 percent, a significant drop.
So the filters allow the architect to explore the impacts of using triple glazing versus double-glazing, argon fill or not, and a whole range of other metrics around building glazing. You still have to design your building freely, but now you have percentages as guides to work with and data about the quality of your glazing systems needed to meet these numbers.
Data on annual solar impact is displayed under the Shading analysis section of the app, helping you make intelligent decisions about shading strategies. All shading strategies considered in the software are purely architectural. Trees or natural shading strategies are not factored into the software at this time.
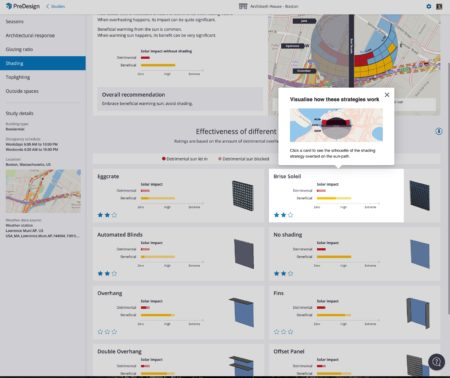
Various shading strategies are displayed and ranked for the user to evaluate for their appropriateness to a given design situation, including facade orientation.
Clicking on the cards for each type of shading strategy will present the user with a results overlay graph of how the device impacts shading. For example, clicking on the Eggcrate shading strategy for the East Facade orientation shows that little direct sun hits the glass, except in the earliest morning hours. A brise soleil option shows that much more sun hits the glass, but generally, all glass is shaded after mid-morning hours. Notably, the overlay easily enables you to see through the shaded section to ensure that red zones on the chart (which means detrimental sun) are blocked, while yellow zones on the chart (which means frequent beneficial sun) are not.
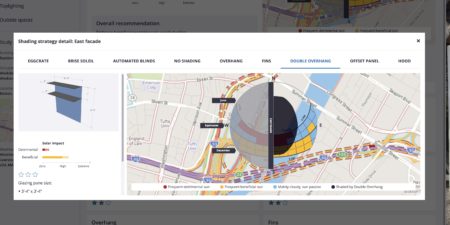
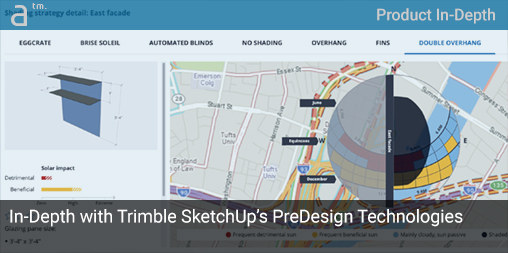
The shading overlay options can be visualized against building orientations laid on top of the classic solar path diagram. The red, yellow, and blue colors correspond to the detrimental sun (red), beneficial sun (yellow), and mostly cloud, passive sun (blue), and dark gray the areas shaded by the device under question.
This part of PreDesign helps the architect test each type of shading device for each solar orientation of the building and evaluate shading needs. In the Double Overhand approach, we can see that all the red zones are blocked while the majority of the beneficial sun (yellow zones) are not blocked.
next page: Two more Features and Closing Thoughts



Reader Comments
Comments for this story are closed