Continued from page 1
Benchmarks
Comparing GPUs with an array of benchmarks is a tricky business. It is especially tough when comparing GPUs over multiple operating systems. In the case of Architosh, we have a long history of addressing the Mac side of the AEC and MCAD markets, so we favor benchmarks that allow us to generate scores that we can take cross-platform. For example, when we last reviewed an AMD GPU, we tested using various tools that work on both Mac and Windows, including real-world apps working cross-platform.
We still favor that approach today, and most benchmark tools below work cross-platform. For this particular review, we focused on the following test suites or testing tools:
- CompuBench* – OpenCL (download link)
- FurMark – OpenGL Stress Test — (download link)
- GFXbench* – OpenGL and DX11 — (download link)
- SketchUp “Test.time_display” (TTD) Test — (see below)
For the test marked with an asterisk above, we tested the W6600 and compared the results to the median score posted on the CompuBench or GFXBench websites. The AMD Radeon Pro W6600 was challenged by the NVIDIA Quadro P4000 (a GPU we have in another workstation) and the NVIDIA RTX 4000 from chart data. In the case of the GFXbench results, we used chart data for both NVIDIA cards. For Compubench we tested our own Quadro P4000.
It should be stated that these cards were partly selected because at times past they claimed to be the most powerful single-slot workstation GPUs available on the market. And they both are still available on the market for a considerable price premium to the Radeon Pro W6600. Let’s look then at how well these challengers fair then against the brand new W6600.
GFXbench
This respected test suite contains many tests. We ran two tests—the Aztec Ruins Normal 1080p tests and the 1080p Tessellation tests. The former tests a modern graphics API across a game-like environment with real-time global illumination and deferred rendering combined with physically-based shaders. The test is applicable to modern games and “game-engine” based rendering tools. We ran this test under both OpenGL and DirectX11 modes.
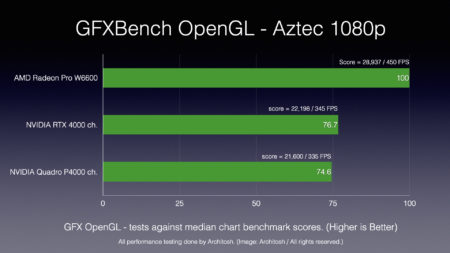
GFXbench Aztec Ruins Normal, 1080p Test. Longer bar is better. Winner: Radeon Pro W6600. (Image: Architosh / All rights reserved.)
As we can see, in OpenGL mode, the chart median scores of the NVIDIA GPUs were very similar and approximately 75 percent as fast as the Radeon Pro W6600. We thought that perhaps the Quadro RTX 4000 would do better using DirectX11, and so it did in that test. (see image below). However, the Radeon Pro W6600 still substantially outperformed it.
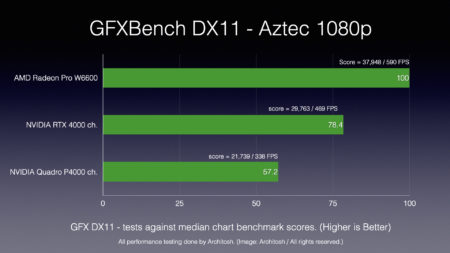
GFXbench Aztec Ruins Normal, 1080p Test. Longer bar is better. Winner: AMD Radeon Pro W6600. (Image: Architosh / All rights reserved.)
The GFXbench OpenGL tessellation tests how well the GPU divides complex polygonal objects in a scene into suitable structures for rendering. Wikipedia’s description says this is particularly important in real-time rendering, where data is tessellated into triangles using OpenGL 4.0 and Direct3D 11.
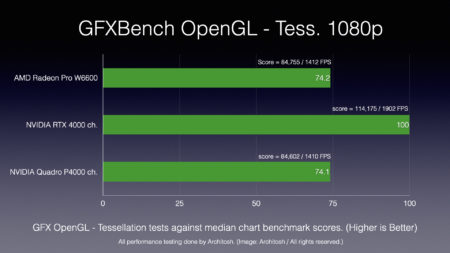
GFXbench Tessellation Test. OpenGL. Longer bar is better. Winner: NVIDIA RTX 4000. (Image: Architosh / All rights reserved.)
In this test, the AMD Radeon Pro W6600 essentially matched the Quadro P4000 GPU, and both were approximately 75 percent as fast as the NVIDIA RTX 4000. Again, the “ch” in the chart images denote that we used published median scores from GFXbench on the web for these values. However, we tested the Quadro P4000 in an HP workstation we have across a range of GFXbench tests to make quick comparisons to published median scores. They were very comparable.
FurMark
FurMark is an OpenGL stress test. The benchmark provides a good amount of data about the GPU while under the load of the tests, including temperature information. Under the test, the GPU was under 94 percent utilization. And its temperature reached 48 degrees Celsius, which is very acceptable. We tested the Radeon Pro only against the P4000, as we don’t possess an RTX 4000 GPU. This applies to the remaining tests.
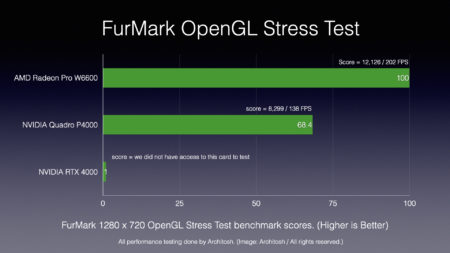
FurMark OpenGL Stress Test. Longer bar is better. Winner: AMD Radeon Pro W6600. (Image: Architosh / All rights reserved.)
Compared to the AMD Radeon Pro W6600, the Quadro P4000 was only 68 percent as fast (performant) on this test. Unlike the GFXbench scores, the NVIDIA card is an actual test score from one of our systems. Differences in the system may play a minor role, as the W6600 is placed in a brand new BOXX system, while the P4000 sits in a late 2017 HP Z workstation with a powerful Xeon processor. Both systems have plenty of memory, but our new BOXX system supports PCIe 4. Regardless, the Radeon Pro W6600 pulled in solid numbers. We ran our tests at P720 resolution rather than P1080, so the online ranges shown here don’t give us a lot to compare.
CompuBench
CompuBench is focused on GPU compute, but their algorithms contain items applicable to the world of advanced professional 3D computer graphics. We ran the famous Catmull-Clark (Pixar fame) SubDivision surface Level 5 test and a Subsurface Scattering rendering test that evaluates how light penetrates and passes through semi-transparent items. Both tests ran using OpenCL.
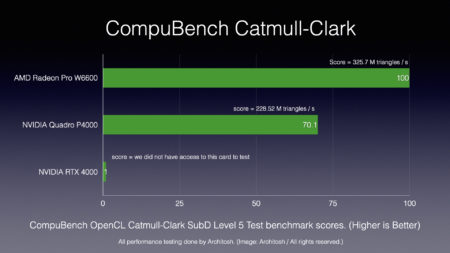
CompuBench Catmull-Clark SubDivision Test using OpenCL. Longer bar is better. Winner: AMD Radeon Pro W6600. (Image: Architosh / All rights reserved.)
As we can see, in the Catmull-Clark SubDivision test, the AMD Radeon Pro W6600 outperformed the Quadro P4000 GPU we have in a different system. (we did not install this PCIe3 card into our newest system, so bear that in mind).
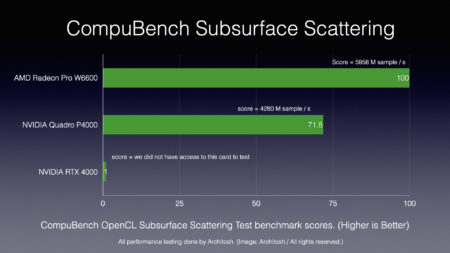
CompuBench Subsurface Scattering Rendering Test using OpenCL. Longer bar is better. Winner: AMD Radeon Pro W6600. (Image: Architosh / All rights reserved.)
In the second CompuBench test, the AMD Radeon Pro W6600 outperformed the Quadro P4000 by nearly the same margin. We have tested OpenCL probably more than is warranted for this article. Still, the CompuBench tests are fascinating, and CUDA isn’t an optional selection on this benchmarking tool for non-NVIDIA cards.
While this GPU is aimed at particular mid-tier CAD markets, this is also an excellent budget-oriented GPU for science and research and film industry OpenCL applications. We ran a few other OpenCL tests practical to such apps, and the W6600 outperformed both NVIDIA reference GPUs. We won’t report those in detail because it is outside the scope of this article.
SketchUp Tests
We have a series of standard-sized and complex/large-sized SketchUp models we have been using in the past. We have used manual timers and FPS counters, and Quicktime in the past to record performances, but this time we used the Ruby Console in SketchUp itself to implement a test that Trimble has shared on its online forums.
Simply typing the text “Test.time_display” into the Ruby Console and hitting the Return key will spin the loaded model in a pre-determined way and spit out a score. The score is in frames per second (FPS). Using the Radeon Pro driver software, we were able to monitor GPU and CPU load during this test. GPU load peaked at the mid 80 percent range for our most demanding version of our files. In other tests, it peaked at around 60 percent. In all cases, CPU utilization peaked at 6 percent or less across all three files.
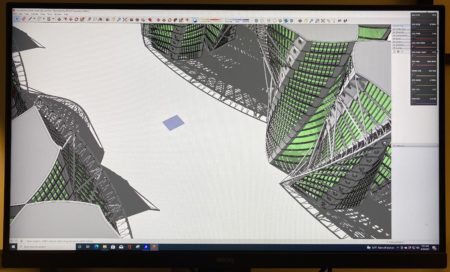
SketchUp TTD FPS test file “TurningTorso” multiple towers, by Architosh Associate Editor, Tim Danaher. This particular image shows our locator plane for placing the camera. The towers are spread in a field array 40x. SketchUp rotates the camera completely around the scene while the observer can see through tower glass to other towers beyond with shadows cast. The test produces up to 85 percent GPU utilization as measured by the Radeon Pro Settings application’s performance monitoring tools.
The first test is a compilation of FPS scores for all three Architosh SketchUp models. Falkestrasse and the TurningTorso Multi Tower models were the creations of Architosh editor Tim Danaher, a very talented and accomplished 3D visualization professional and product reviewer for this site in the past. A third model is a rather sizeable file by SketchUp standards filled with textures, mainly landscape textures. (see images below).
In the first SketchUp TTD compilation test, the AMD Radeon Pro W6600 outperformed our NVIDIA Quadro P4000 system and an AMD Radeon Pro Vega 56 in our iMac Pro, thrown in the testing for another reference. Anybody in possession of a late-2017 iMac Pro knows that the 5,000 USD Mac workstation is a very capable machine. To that point, see our second SketchUp TTD test results below.
In our three file tests, the 102 MB landscaped residence file stressed SketchUp the most; FPS scores ranged from 22 FPS to 29 for the Radeon Pro W6600. We had two scenes in the Falkestrasse file, an old deconstructivist landmark building modification in Vienna by Coop Himmelblau. FPS ranges were between 41 and 63 FPS. The combined FPS performances of our three files are indicated in the chart below.
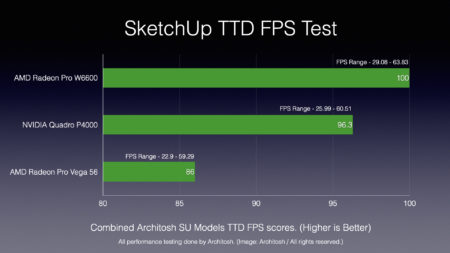
SketchUp TTD FPS Test for Combined Architosh SU Models. Longer bar is Better. Winner: AMD Radeon Pro W6600. (Image: Architosh / All rights reserved.)
We know from Trimble’s comments in its forums, in addition to user comments, that files with transparency stress Trimble’s time-display Ruby test the most. The TurningTorso file was thus modified by multiplying the 4-towers 40 times. This slowed down the SketchUp TTD test quite a bit, and frame rates per second fell considerably. This test was the one that pushed GPU utilization to the mid 80 percent range.
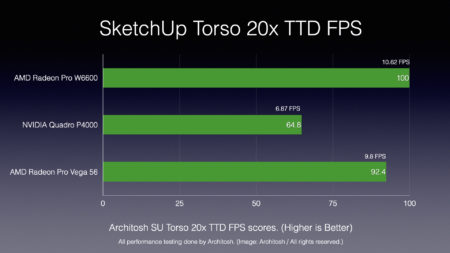
SketchUp TorsoTower 20x TTD FPS Test. Longer bar is better. Winner: AMD Radeon Pro W6600. (Image: Architosh / All rights reserved.)
In this more demanding test, the AMD Radeon Pro W6600 still defeated the two reference systems by 35+ percent over the NVIDIA Quadro P4000. However, the iMac Pro also beat the P4000, coming in at 92 percent of the W6600. The workstations are all different, and this might explain the change. This test is also sensitive to system memory, so each test must happen after a fresh system restart with nothing loaded other than SketchUp upon reboot. We did these 3x on each system and took the averages.
As you can see from our benchmarking applications and real-world tests using the ubiquitous SketchUp and popular Twinmotion, the AMD Radeon Pro W6600 delivers solid to outstanding performance, against a range of specific algorithms used in 3D computer graphics and rendering, and across OpenGL, DirectX, and OpenCL.
Closing Comments and Recommendations
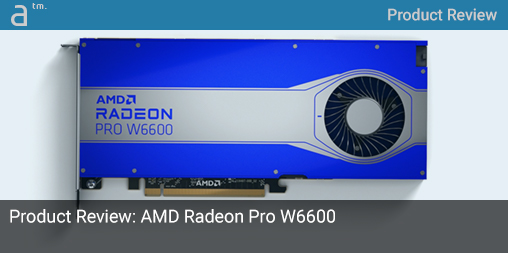
While not nearly as powerful as its bigger sister—the AMD Radeon Pro W6800—the new W6600 GPU is a workstation-class GPU with excellent performance characteristics. For a single-slot “workstation-class” GPU we doubt there is a better value in the market. Even NVIDIA’s aging Quadro P4000 (widely available online) is considerably more expensive, and its original MSRP was in the mid 800 USD range. Contrast this to AMD Radeon Pro W6600 at 649 USD, and it’s a no-brainer. That is, so long as your workflow does not depend on specific NVIDIA hardware acceleration technology.
All a software developer needs to do to take advantage of the Ray Accelerators on the W6600 GPU or its bigger siblings is program to a standard like DirectX Raytracing (DXR) or adopt AMD’s open-source solution Radeon ProRender (on GPUOpen). In terms of the latter, Nemetschek’s Maxon is already an integrator, and Maxon’s rendering technology is integrated into Archicad and Vectorworks. And other integrators of ProRender include Modo and SolidWorks. We anticipate Nemetschek’s daughter company solutions based on Maxon to also benefit from AMD’s Radeon Pro series in the near future. So in addition to Autodesk’s popular products (Revit and Max) we see this GPU being a great investment for powering Nemetschek’s various rival solutions (Archicad, Cinema 4D, Redshift, and Vectorworks).
The Radeon Pro W6600 offers fabulous performance per dollar value, takes up only one PCI slot, and is power-friendly. In short, this is a GPU that is easy to recommend for users in pro markets that need a workstation-class GPU with ISV certifications.
Pros: Superior performance per dollar for a workstation-class GPU in the sub-1000 USD range; this GPU offers significant value across large deployments in big organizations; outperforms popular Quadro P4000 and its successor RTX 4000 in many benchmarks; boasts unique Viewport Boost technology to balance frame-rates per second (FPS) and image resolution, working inside popular AEC tools like Revit, 3ds max, and Twinmotion. Offers real-time, hardware-accelerated raytracing at a very attractive price point and leverages DirectX Raytracing (DXR) and AMD’s Radeon ProRender technology to tap Ray Accelerators.
Cons: Fewer pro apps leverage the new hardware-accelerated raytracing technology in the new AMD Radeon Pro 6000 series than compared to NVIDIA’s RTX technology, but that could change over time.
Advice: The AMD Radeon Pro W6600 is presently in a class of its own. If your apps don’t require NVIDIA exclusive tech, this W6600 delivers the best performance for cost metrics in the industry for workstation-class GPUs with ISV certifications.
Costs: 649 USD MSRP



Reader Comments
Readers should also check out our newest feature article that delves into the AMD RDNA 2 Architecture. You can see the link below as well as in our Related section above.
Readers may not be aware of how dramatically chips are being re-architected as transistors increase and chips shrink to keep up with Moore’s Law. This pressure on ship shrinkage is making it necessary to rethink how to package up all the components on a chip because while logic and memory may make sense to continue to shrink down to smaller processing nodes, other components on a chip like I/O do not. This is why companies like AMD have innovated to “chiplet” design, which the whole industry will see much more of in the near future.
Comments are closed.