VECTORWORKS 2024 IS THE LATEST VERSION OF THE POPULAR BIM platform for AEC, landscape, entertainment, and event design (E&ED) professionals. We recently spoke to Martyn Horne, Director of Product Marketing, and Luc Lefebvre, Product Marketing Manager – Architecture of Vectorworks, Inc., about how Vectorworks outperforms BIM rivals in the narrow but essential area of “data.”
Why is this a big deal worth a lengthy discussion?
It’s a big deal because the “I” in “BIM” stands for “information,” and to get at critical information—and recall from this article here that “information” sits on a spectrum between “data” and “knowledge—one must have that information smartly organized. When data isn’t well organized, you can’t get to information. And if you can’t get to information, you can’t get to knowledge. That’s a big problem in a knowledge economy and a bigger issue in an emerging one with artificial intelligence at its center.
A Data Difference
Many industry design professionals falsely assume that nearly all programs in the CAD-BIM industries work with data in more or less the same way. While, to some degree, that may be true, some platforms have clear, legitimate reasons for data differences—or how their software platform manages data differently than their rivals. Vectorworks is one such program.
Part of the “data difference” exists because the company has BIM tools for multiple design industries—not just architectural professionals. Yet another reason is that Vectorworks’ development philosophy—manifest in its mantra “design without limits”—has long been about flexibility.
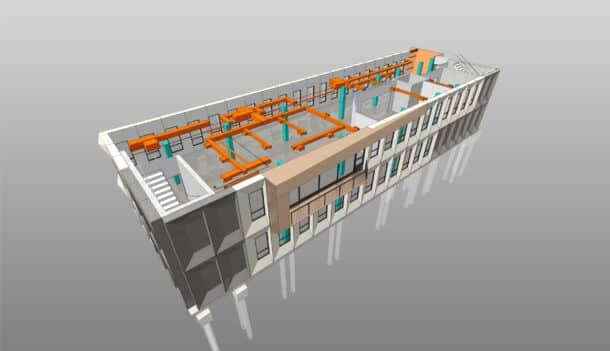
Vectorworks 2024 gains additional strengths in its existing Data Visualization capabilities, thanks to its latest data feature updates. (Image: Vectorworks, Inc.)
“We are a design-based BIM software company,” contends Martyn Horne, “and we have flexibility across the platform. We have several areas where flexibility makes a difference—from the breadth of our modeling tools, the differences we provide with our presentation capabilities, and the multiple routes for working with data. It all comes back to this idea about flexibility.”
Vectorworks’ history helps explain its emphasis on being flexible. From the beginning (Minicad days), the software served many types of CAD professionals. Architects were just one of the larger groups. It learned to develop “flexible features” to meet the needs of a diverse set of users before it eventually developed “industry vertical” software built around its advanced BIM-CAD Vectorworks core. Now, the company is tightening its workflows, isolating tools, and guiding users in particular workflows within a more industry-specific and Jobs-to-be-Done (JTBD) paradigm.
Regarding managing data, some industries have divergent needs and methods compared to architectural professionals operating within the BIM-centric AEC industry. Martyn Horne explains:
We are a design-based BIM software company, and we have flexibility across the platform.
“We can work with existing tree reports from landscape architects,” noting how different landscape design professionals manage some parts of their workflows compared to architects. That data tends to be alphanumeric tabulated data but in particular formats and layouts germane to that industry. So the data difference for us is we fully embrace and support that industry’s specific data needs and the result is we have superior data flexibility built into Vectorworks’s core.”
Data Interop
Being a modern BIM authoring application, Vectorworks has world-class file interoperability (in and out). “We have several ways of bringing in industry-standard data, everything from IFC, Shapefiles from a GIS perspective, and even several proprietary routes to get data in, adds Horne.
Before getting into the data differences in detail, it should also be noted how Vectorworks has long supported numerous open standards around data interoperability. Vectorworks, for example, is a champion of Open BIM. It has long supported open database connectivity via ODBC drivers. This industry standard makes it possible to access data from any application, regardless of which database management system is handling the data.
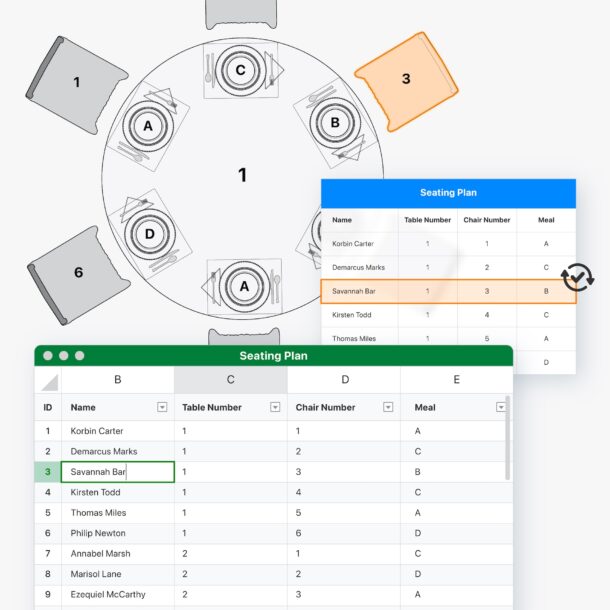
Vectorworks 2024 introduced cross-platform, truly round-trip, live syncing between Vectorworks structured data connected to objects and BIM objects and Microsoft Excel.
And Martyn Horne adds, “We very recently introduced very specific Excel referencing, which means we can link data live right in Excel. It means being able to bring data in, change the data [in Vectorworks] from an external perspective, and automatically update that date within Vectorworks,” he adds.
This latest data capability is a bit like the proverbial “icing on the cake” for an already robust data story. Most BIMs just manage to allow data worksheets to be exported out to Excel format, or to import them in. Having them “live linked” bi-directionally is a market-leading feature.
Data Sheets—A Data Dashboard
To really understand the data difference in Vectorworks, we need to pull the cover off some of the features at issue.
Vectorworks has long had its useful Object Info Palette (OIP). The OIP is a small palette that presents the user with an object’s essential data, from a 2D object’s area and perimeter to a 3D object’s volume and surface area.
The OIP organizes all object data under three tabs: Shape, Data, and Render. The first tab is dimensional by nature, but it lets you change an object’s class and layer settings and give an object a specific name. The second data tab is like the information dashboard inside Vectorworks on an object-per-object basis. You can attach a custom data record or IFC data to an object.
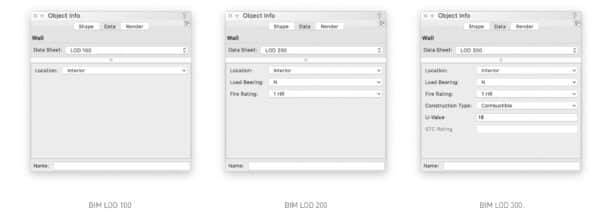
Data Sheets and their fields appear inside the Object Info Palette (OIP). Click to enlarge the view.
However, since version 2020, you can access and utilize a Data Sheet in the OIP when working with objects. A Data Sheet is a group of fields that the user can select from within the Data tab in the OIP and enter data. What those fields are depends on which data set is attached to that object type. Therefore, what fields the user sees depend on the associated data set, and these can be standard Vectorworks parameters, IFC fields, or custom fields defined in a custom record you attach to an object. You can also use formulas in data fields, but more on that later.
In the example images below, a named Data Sheet is referred to as LOD 100. At this level of detail (LOD), the only key data aspect about a wall is its “location.” Another image shows a Data Sheet named LOD 200, which includes additional data fields the user selects from drop-down menus. And LOD 300 is shown on the right. A user can create multiple Data Sheets associated with specific objects that are linked to named custom data sets.
The new Data Sheets features in the Data Manager are quite powerful. For example, they allow you to assign “ranges” to data fields, and these can be things that relate to building codes or other standards.
“Let’s use the example of a door,” says Luc Lefebvre. “Say you assign all door objects to a data mapping that includes ranges in a Data Sheet. Now you can click on a door object, and in the OIP (Object Info Palette), if the door width or height or some aspect doesn’t fit into a range value—like maybe the minimum width to meet ADA—it will highlight in red in the OIP.”
“One thing that is cool about the Data Sheets,” notes Lefebvre, “as you know, the dictionary of IFC data fields may not be as user-friendly as one might imagine. With the Data Manager and Data Sheets in Vectorworks, the user can rename those IFC fields so they are user-friendly inside the OIP (Object Info Palette). That makes it much easier for your team to understand what fields are referring to.”
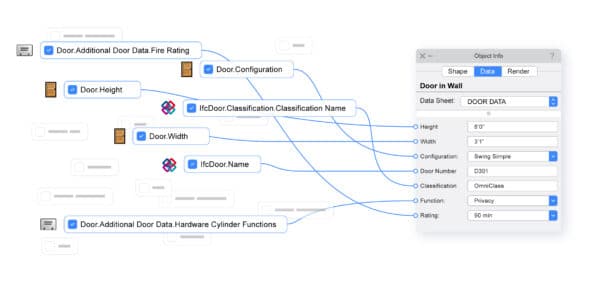
A concept of view of how IFC standards can be remapped to custom field names in the OIP. This makes IFC more user-friendly and more clear to end-users when working with BIM data over the life of the project. Click to enlarge the view. (Image: Vectorworks, Inc.)
“And because you can start with a specific Data Sheet like the LOD 100 example,” adds Horne, “when working on a team, your team is presented only with levels of information they must deal with at that phase of the project, rather than getting all that information at the very beginning.”
Data Manager-Data Mapping
The Data tab in the OIP can grow in complexity over time, a really unique feature of Vectorworks. It can show more levels of data for each object type as the project progresses. In some cases, an object may be a non-standard BIM object or custom object and have no or little data assigned to it at the schematic or preliminary phases of design. Later on, such objects can get data assigned or mapped; they may get standard object parameters data, IFC data, or custom data mappings that do or do not convert over to IFC data mapping. The system is entirely fluid and flexible.
With the Data Manager and Data Sheets in Vectorworks, the user can rename those IFC fields so they are user-friendly inside the OIP (Object Info Palette). That makes it much easier for your team to understand what fields are referring to.
“We have spoken about the level of detail (LOD) in BIM processes, but some objects don’t fit industry standard BIM object types in IFC,” says Horne. “This is where class-based mapping is very powerful and flexible. Even at an earlier stage where you are dealing with masses and volumes that aren’t yet industry standard BIM things but will be down the road, class-based mapping provides a streamlined way to getting data around those types of objects.”
Class-based Mapping
Horne and Lefebvre remind me that some building types, like museums or retail spaces, include a lot of custom-built items that challenge IFC object standards. “These elements are ideal for class-based mapping,” says Horne.
Other examples include custom furniture, smart walls and assemblies with AV items, media objects, and other similar custom-built non-standard BIM objects. Not everything in architecture is a wall, slab, roof, or window.
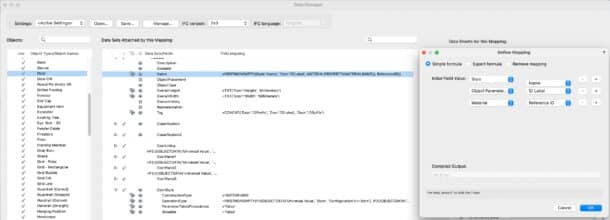
An image of the Data Manager where data mapping is managed. Click to enlarge the view. In Vectorworks 2024, there are multiple methods to map data to objects, including highly efficient and flexible “Class-based mapping.”
“It’s about flexibility,” says Horne. “Data isn’t just used in the BIM process, we are more than just a BIM software company; we offer multiple routes to design.” This is where the industry vertical solutions come in. Vectorworks Landmark is the market-leading BIM solution for landscape design professionals, including master planners and urban design professionals. Their data needs are unique from architects despite engaging in the BIM process. Vectorworks Spotlight is the leading CAD platform for entertainment and AV design professionals. BIM is even less central to this vertical sector, but data management associated with objects is as intense as a building.
The industry verticals have encouraged a type of “nimbleness” with data management in Vectorworks, while its powerful 3D modeling capabilities have predated much of the BIM revolution.
“People tend to think of BIM and parametric object types and the data that is tied to those types of objects,” says Horne, “but we have much broader modeling capabilities, as you know, and that enables our users to be highly creative in developing in 3D what I would call non-off-the-shelf objects for their architecture. Here, you can apply data to such objects, whether non-BIM data or part of the BIM data process.”
Dynamic and Formula Mapping
“We have already established we have data mapping by class, and we can also have automated mapping by object or location of object,” says Horne. In this, we have this ability to create dynamic auto-mapping.”
This means that when a user assigns a class to an object, that object will get data mapping automatically applied to it. Likewise, if that object is on a certain layer, the same thing can happen. This automation of sorts even applies to an object’s material assignment.
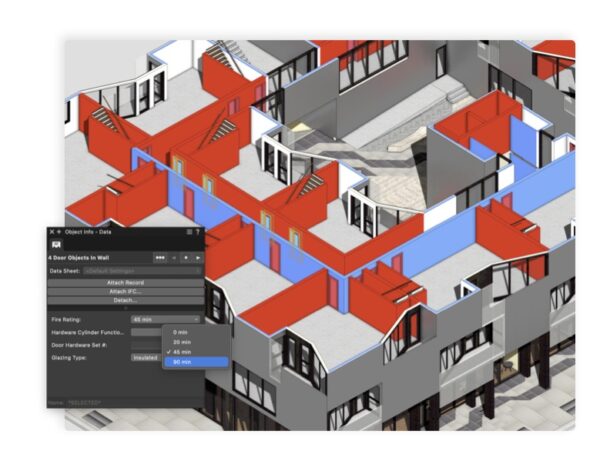
Data visualization is a powerful natural extension of Vectorworks’ flexible command of using data. Architects can use data visualization as part of their BIM model quality assurance. (see next section below). (Image: Vectorworks, Inc.)
“The Data Manager allows you to put in simple IF statements,” adds Luc Lefebvre. “Similar to the kind of thing you would do in Excel or inside Vectorworks’ worksheets, these IF statements condition what happens to data mapping assignments.”
Quality Assurance
Users can even put in “conditionals” on an object’s dimension fields. The Data Manager supports the same type of Excel-like formulas like “greater or less than or equal values.” Again, you can use these formulas to dynamically calculate data and input that into specific fields, which, in turn, draw data from multiple fields. Consider, for example, the required area and minimum dimension for an emergency window in a bedroom per the fire code. It’s not just the minimum width and height but the area. All these conditions can be tested, and the result figure can be tested against a range value. If it fails, the OIP can show the result in a red color, or the same calculation can be used as part of Vectorworks’ Data Visualization features to graphically illuminate quality aspects of a building design or BIM model.
Data Visualization
Data visualization has become table stakes in the leading BIM authoring tools for a few years. Yet, its power and usefulness are directly tied to how streamlined and easy it is to assign all key objects in a model the appropriate data.
“Data visualization is part of the sum of all of these data differences,” emphasizes Horne. “There is this continuity throughout Vectorworks in how we address data. Just like we have long had these Excel-like conditional functions in our worksheets, they are all now available in the Data Manager as part of our data mapping processes. And data visualization uses these same conditionals on the data that gets mapped, dynamically applied, or entered via the OIP,” adds Lefebvre.
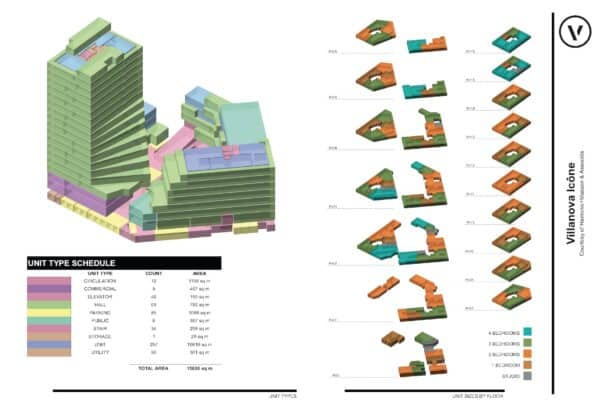
An example use of Data Visualization in Vectorworks, operating on data associated with function and unit types for a multi-story building mixed-use building, including a graphical breakdown of residential unit types.
He emphasizes that data visualization is key to doing solid quality assurance (QA). “You can, for example, set up a data visualization to highlight any objects that don’t have IFC data mapping,” he says. “Used this way, it can help you before you send an IFC file to a consultant. It can help you ensure fire ratings, ADA compliance, and other critical model quality checks are in place.”
Closing Thoughts
It is important to note that Vectorworks’ BIM history, while long, overlaps with a longer history of serving design professionals with a 2/3D CAD tool across multiple industry sectors. This history has much in common with tools like AutoCAD, except Vectorworks successfully transformed from a CAD tool to one of three or four globally leading BIM platforms.
To put this in sports terms, tools like Vectorworks, AutoCAD, or Microstation were like decathlon or pentathlon Olympic athletes—capable of excelling in multiple events. When BIM emerged in AEC, it introduced a whole new event. It was like introducing NASCAR to the Olympics. Imagine Caitlyn Jenner suddenly needing to become a race car driver while maintaining elite decathlon skills.
In this context and with this history, we can understand how the data difference in Vectorworks feels quite natural. The program supports established BIM standards while featuring data management agility necessary for its legacy users and vertical industry users alike.



Reader Comments
Comments for this story are closed