
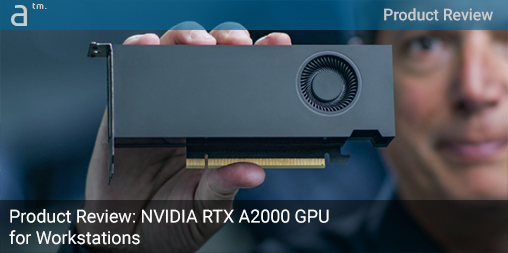
NVIDIA THIS YEAR RELEASED ITS new ‘Ampere’ generation RTX A2000 GPU, a workstation GPU aimed at the lower segmentS of the workstation market. The GPU has an MSRP of USD 450.
The big news about this tiny GPU is it supports NVIDIA’s hardware-accelerated real-time RTX raytracing technology. And it does so in a low-profile GPU form-factor that works ideally in SFF (small-form-factor) workstations. SFF workstations are often found in architecture and engineering practices because they take up less space.
Given our more dominant AEC focus at Architosh, the folks at NVIDIA provided us with this new RTX A2000 GPU so we could give it a good spin in both benchmarks and real-app testing. And that is precisely what we have done.
NVIDIA RTX A2000 Details
Before we jump into the results, let’s cover the basics of this Ampere generation tiny GPU. First off, the card is so tiny it almost feels cute. But don’t let this fool you. The RTX A2000 packs a very decent punch.
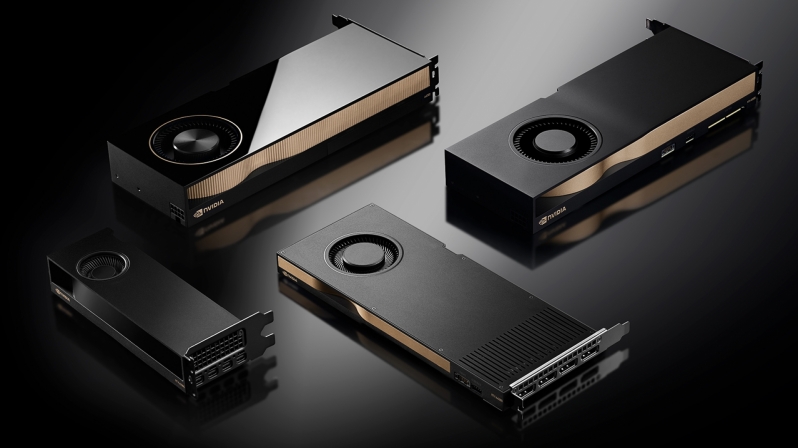
NVIDIA’s RTX A-series lineup for the workstation market. Lower left, the double-slot RTX A2000. Upper left: RTX A6000. Upper Right: RTX A5000, and lower right, single-slot RTX A4000. Only the A2000 can fit in tiny SFF (small form factor) workstations. (Image: NVIDIA / All rights reserved.)
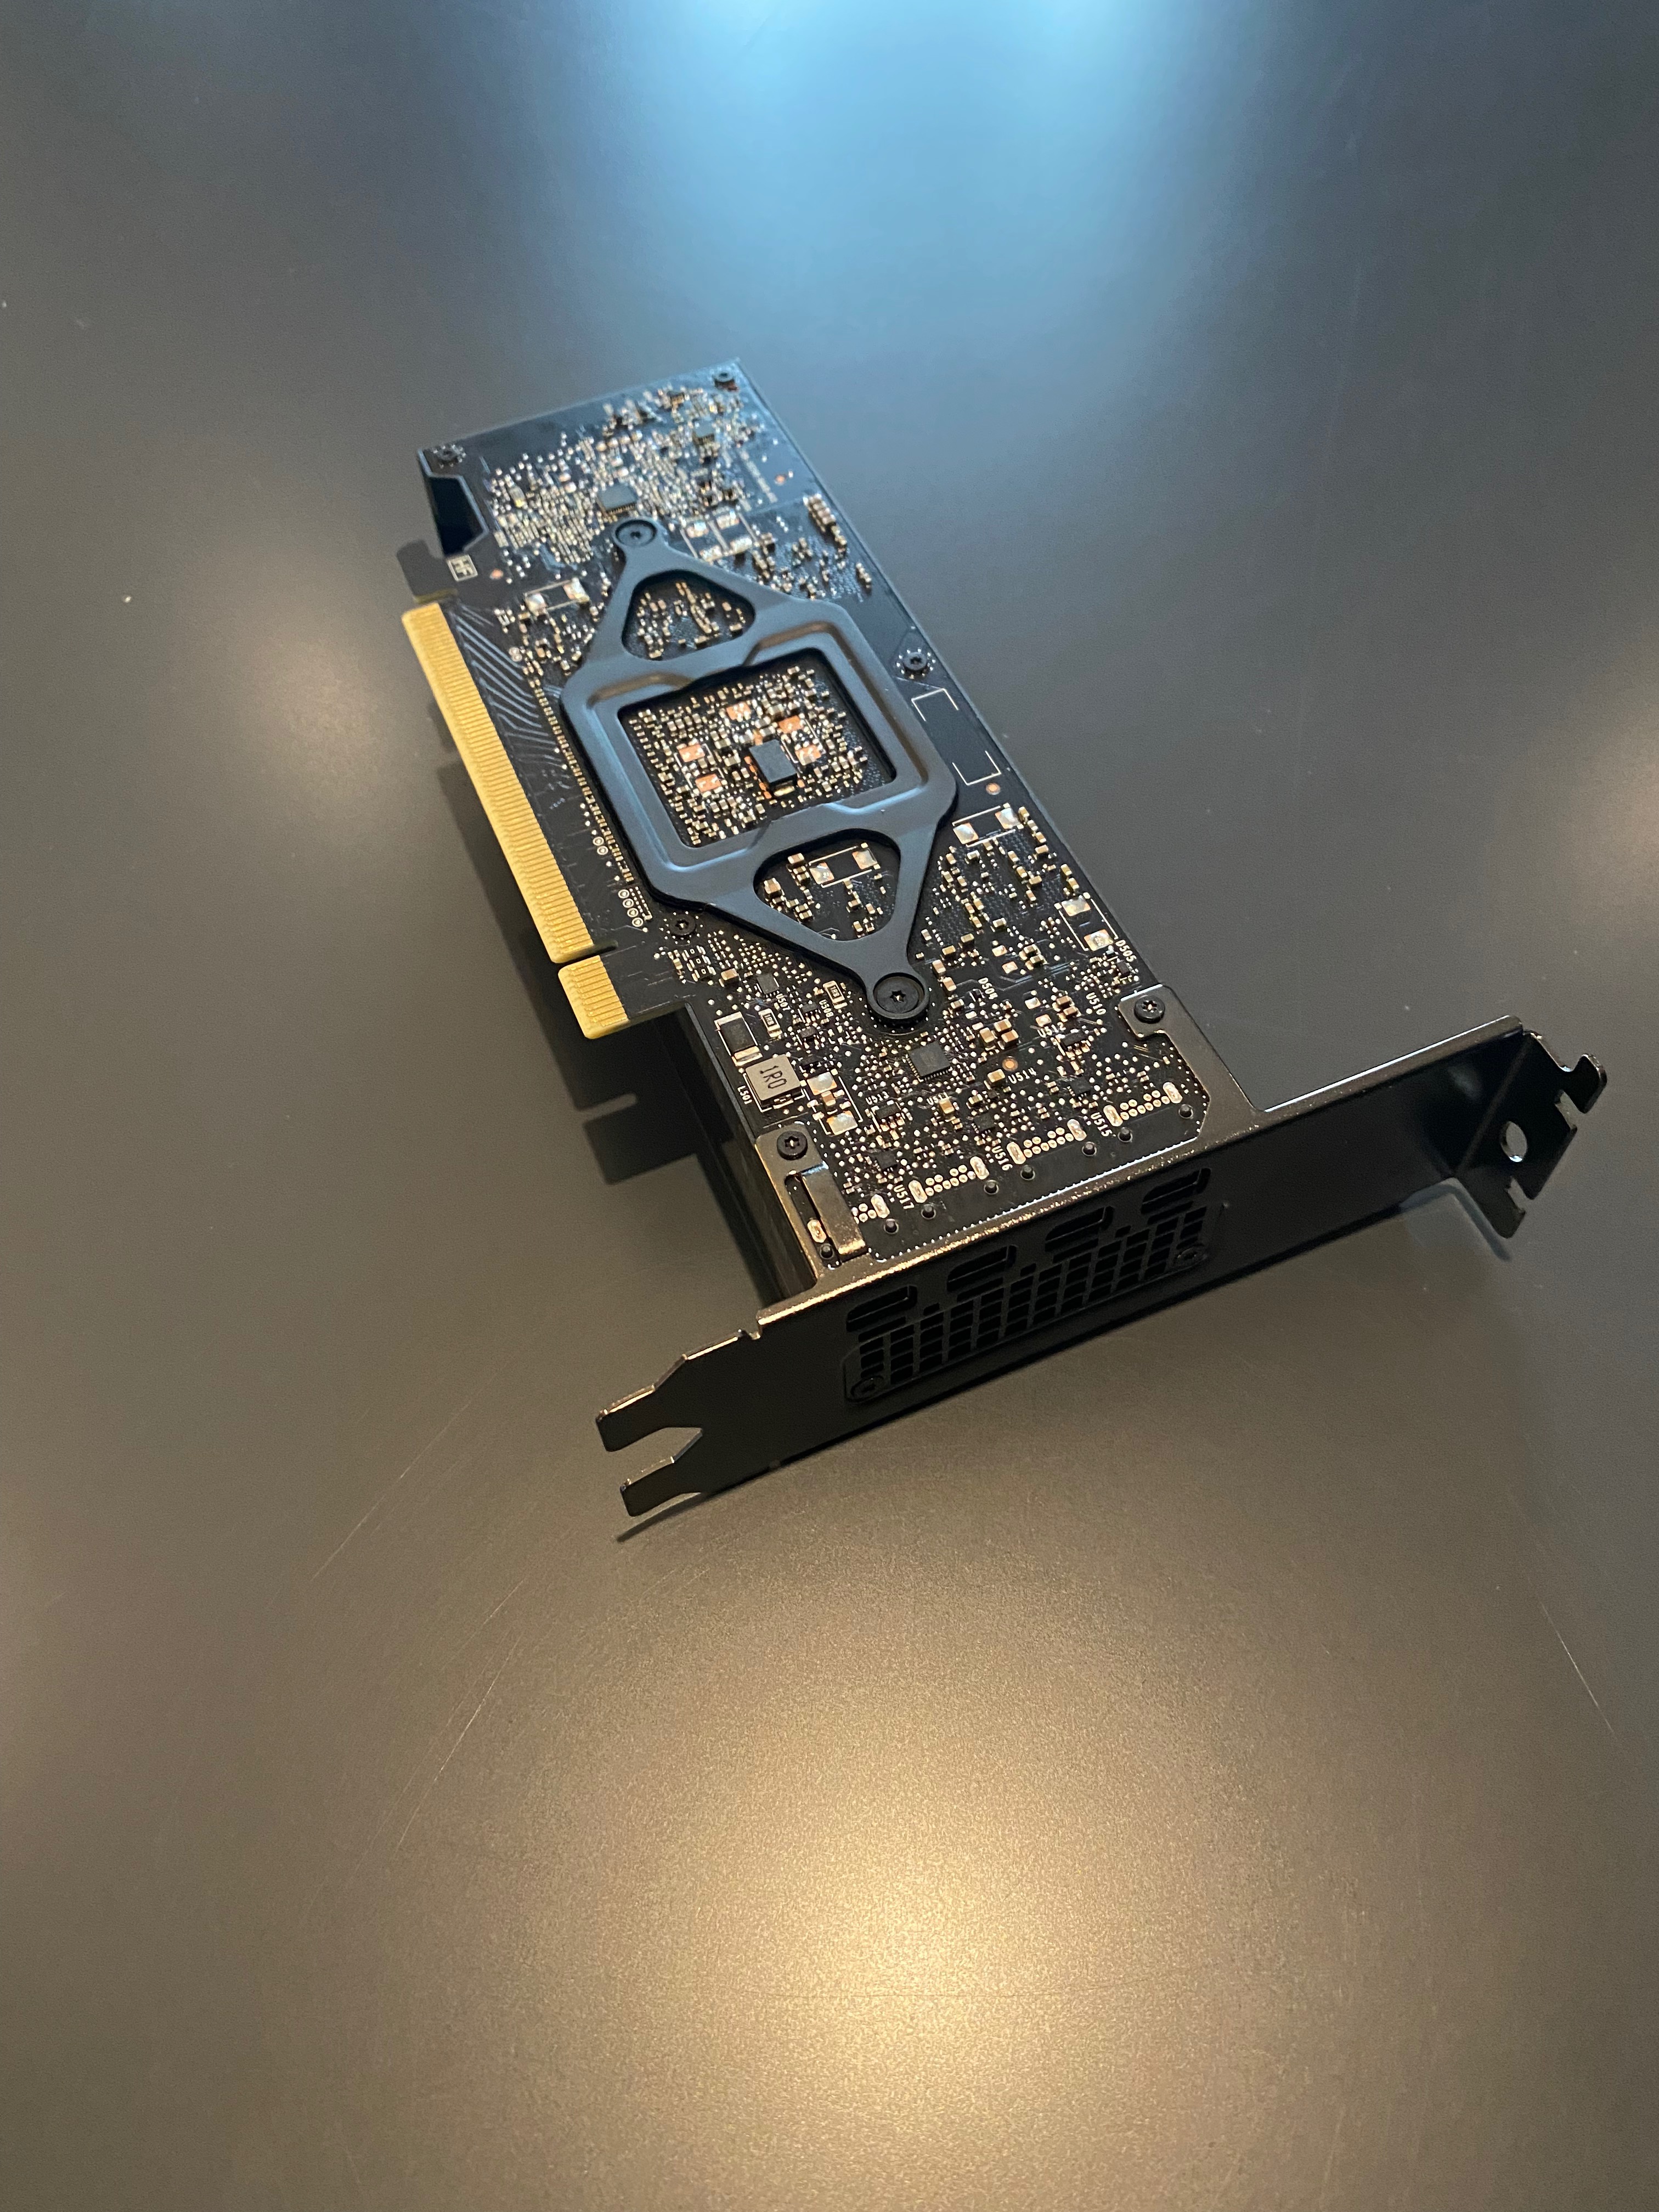
The unit comes with 6GB of GDDR6 ECC memory, and there is an optional version with 12 GB. One will find 4x Mini DisplayPort connectors on the backside (see images below). Despite being small and low-profile, the RTX A2000 is a doublewide card. It can work with a low-profile bracket or a full-height bracket like ours was sent to us. It supports PCI Express-4.
RayTracing
The RTX A2000 brings NVIDIA’s workstation-class hardware-accelerated raytracing technology down to the entry-level workstation-class GPU range. In the previous workstation generation GPUs, RTX technology stopped at the Quadro RTX 4000, and everything under that was RT-free, meaning no raytracing cores.
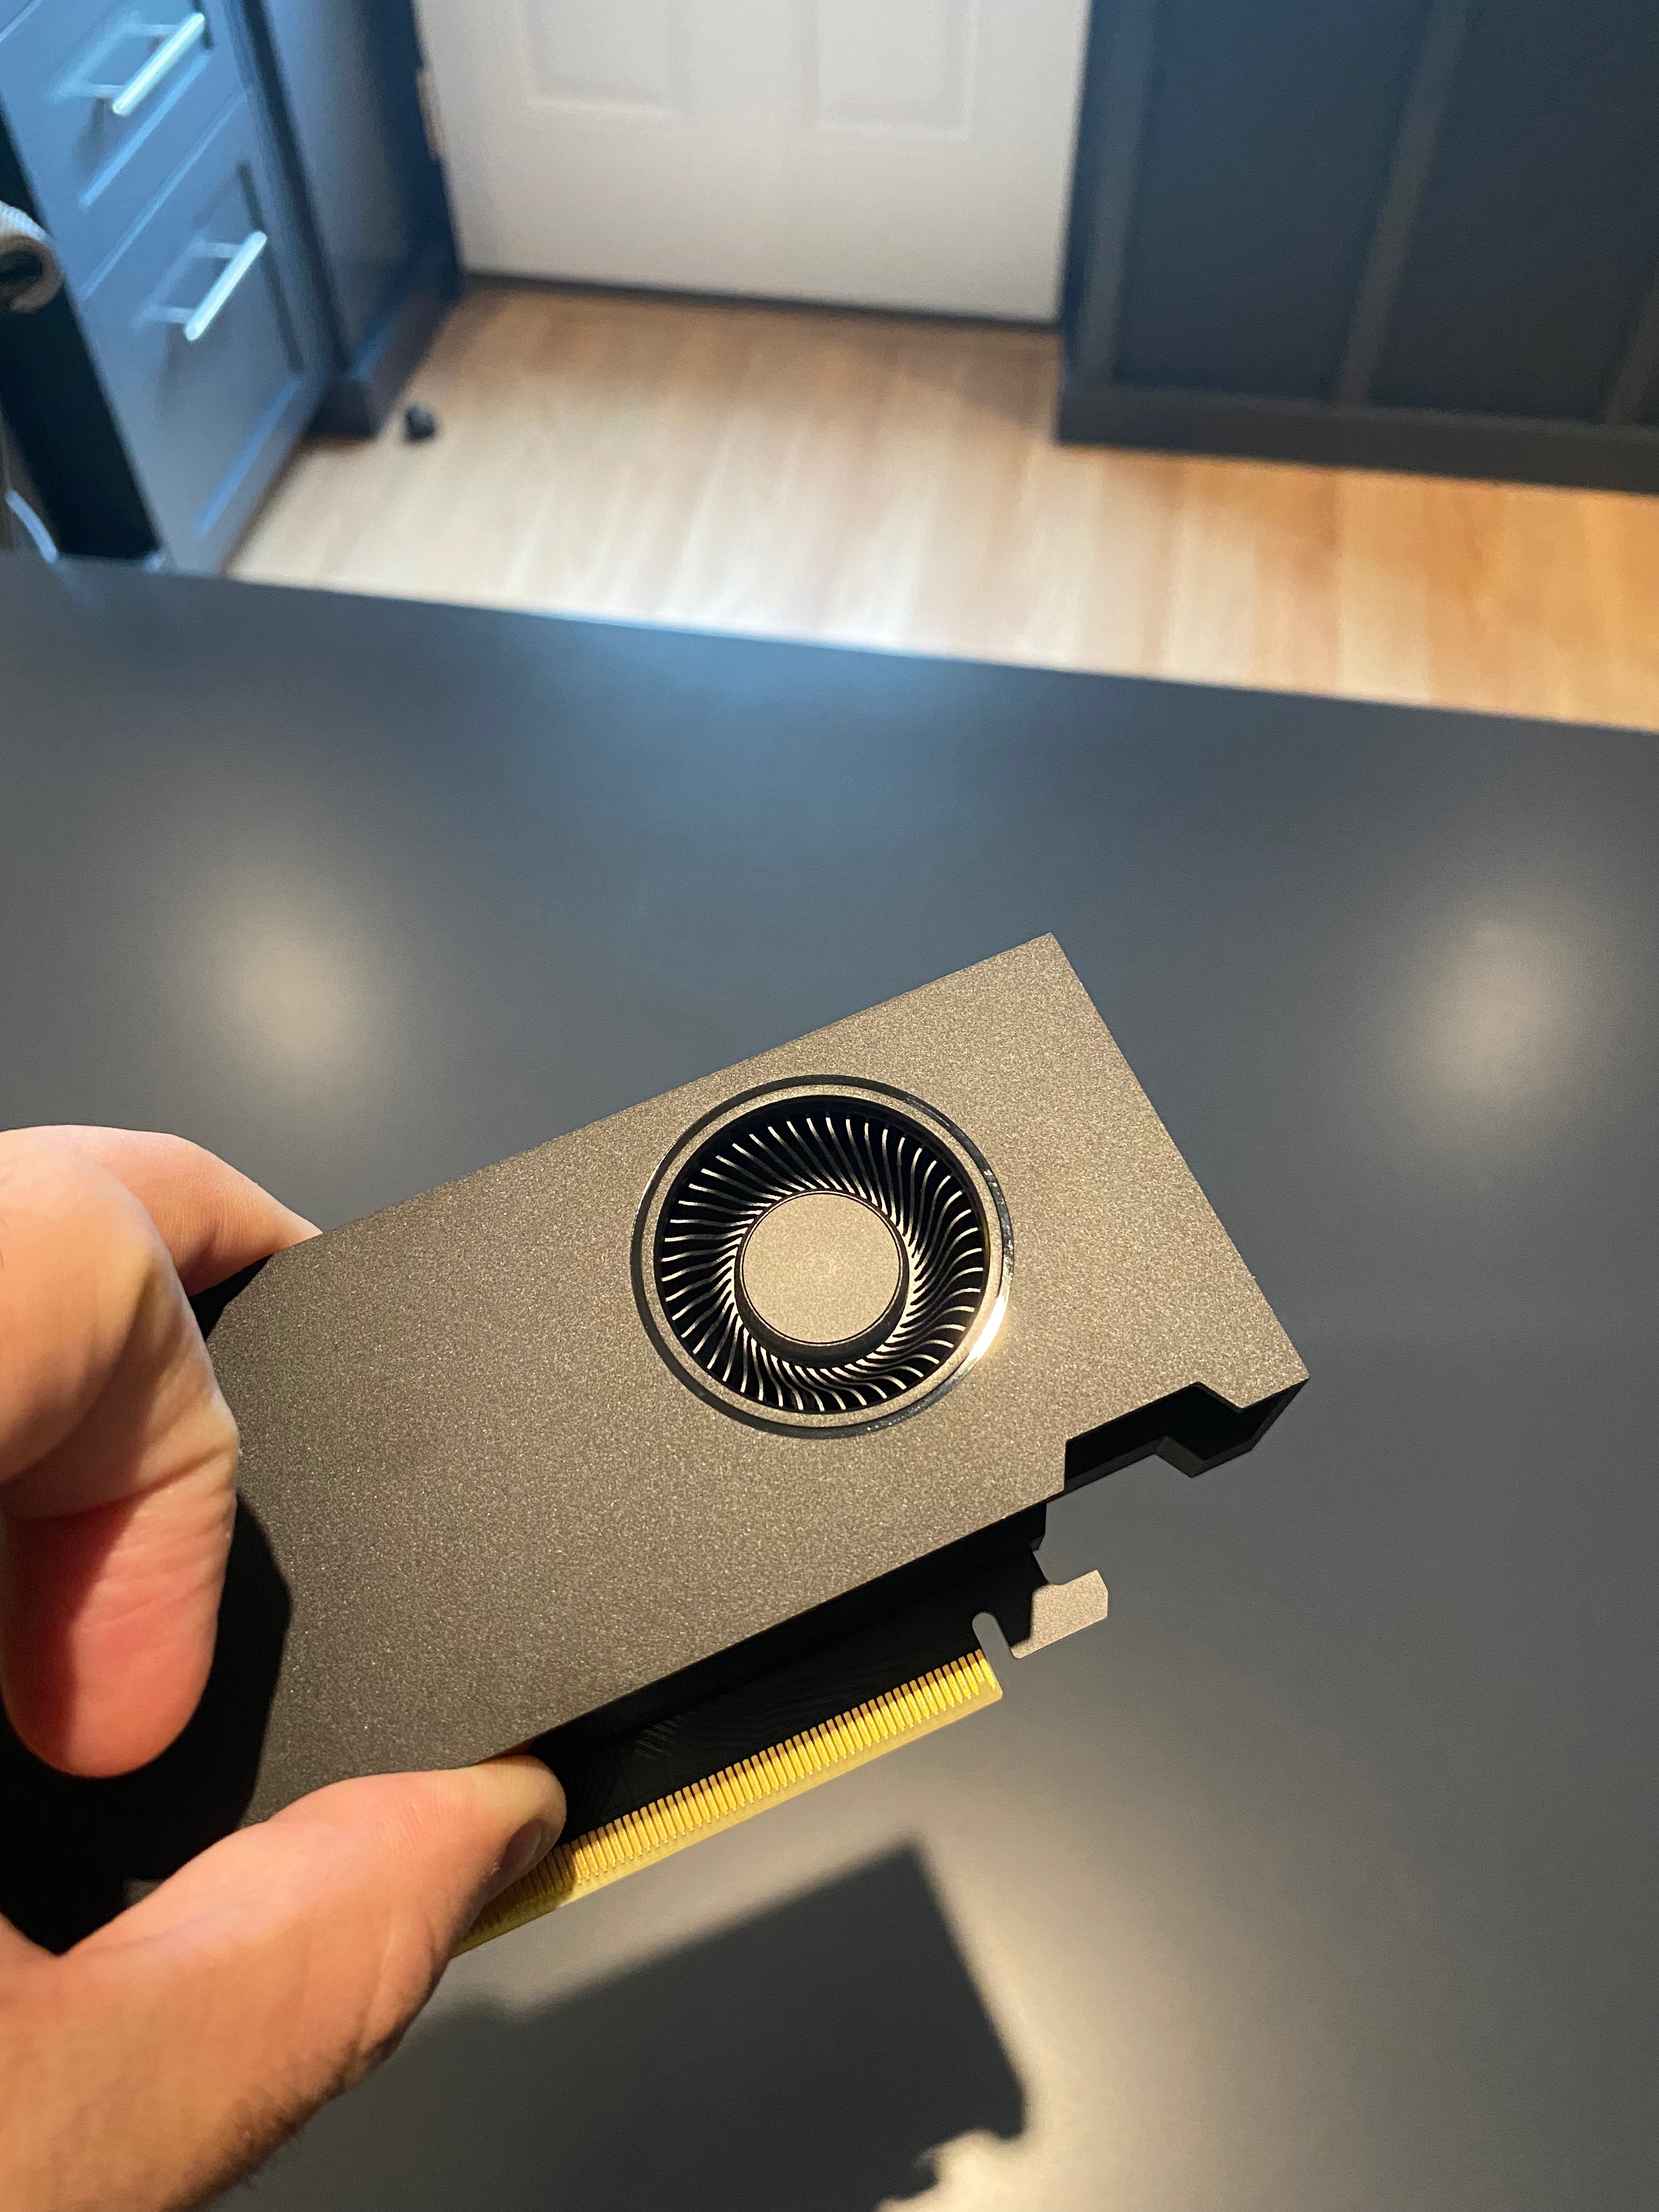
The tiny fan on the rather tiny A2000. One issue we talk about at the end of this article is the fan noise.
The RTX A2000 delivers 8 peak TeraFlops single-precision (FP32) performance, compared to its previous generation at half that value. From our recent review on AMD’s new GPU, our readers learned that our own reference NVIDIA GPUs, the Quadro P4000, has 5.2 peak TeraFlops (FP32). We will be referencing that unit in some of our benchmarks below.
The RTX A2000 possesses ‘second-generation’ RT cores with hardware-accelerated motion blur and 2x faster raytracing. We tested the raytracing and CUDA cores using Chaos’ V-Ray-based rendering benchmark. (see charts below). In terms of cores in general here is the breakdown:
- 3328 CUDA cores
- 26 second-gen RT (raytracing) cores
- 104 third-gen Tensor Cores
Installing the RTX A2000 was straightforward. We dropped it into our 2021 year model BOXX Technologies testing workstation. The card is powered entirely through the PCI bus; the A2000 has a TDP of just 70 watts.
Performance Tests
At Architosh, we have been trying to establish a suite of “cross-platform benchmarks” and real-world app tests as much as possible. In this case, however, fewer cross-platform benchmarks were deployed. We focused a bit on proprietary CUDA and RTX technology.
The RTX A2000 features NVIDIA’s 8nm GA106 GPU, 276m2, 13.2 million transistors, manufactured by Samsung.
Our tests utilized OpenGL, OpenCL, and DirectX graphics APIs—all representative of industry-wide leading tools and workflows across multiple 3D/CAD industries. Here is a listing (in order) of our benchmarks and tests:
- SketchUp TTD FPS — an OpenGL real-world application set of timed tests using our own set of files.
- Twinmotion — we did run NVIDIA’s free FrameView tool in the background to monitor frame rates.
- CompuBench (SubDivision) — OpenCL GPU compute on SubDivision surface level-5 test.
- CompuBench (Subsurface Scattering) — OpenCL GPU compute rendering test.
- GFXBench (Tessellation) — OpenGL mode test
- GFXBench (Texture – Fill Rate) — OpenGL mode test
- VRMark (Orange Room) — a VR test to see if your GPU is ready to power VR headsets.
- V-Ray 5 Benchmark — RTX and CUDA tests were run.
This set of benchmarks and tests looks at OpenGL-based viewport performance in shaded, textured, and shadowed 3D models, GPU rendering across OpenCL, CUDA, and RTX technologies, and OpenGL-based geometry mesh generation (OpenGL 4) and texturing performance.
next page: Performance Results and Closing Recommendations
Performance Results
For this review, we will start with real-world applications. SketchUp is the world’s most popular 3D modeler and the most common modeler in the world of architecture. Twinmotion is the only cross-platform real-time interactive renderer, a global favorite based on Unreal Engine technology. Taken together, these constitute a popular if not dominant real-world scenario in many AEC practices.
SketchUp Tests
SketchUp is symbolic of the predominance of “CPU, frequency-bound” CAD industry applications. That doesn’t mean your GPU doesn’t factor into your SketchUp performance. It does, in fact, and especially manages raster effects like shading, textures, shadows, and fog, for example. (see our Notes Section, for more info below)
Our three test files range in size from 1.3, 13, and 200 megabytes. We run the “Test.time_display” FPS test that Trimble has shared in its user forums. It can work on any file. Simply typing in the text “Test.time_display” into the Ruby Console in SketchUp will rotate a model, producing 72 rendered frames and spit out a total time to complete all 72 frames and an FPS (frames per second) score. Approximate ranges for each of our three models span between 10 – 60 FPS.
We have run two tests in the Garden House file, two tests in the Falkestrasse file, and three tests across three iterations of the TurningTorso Tower model. The latter two models are the work of former Architosh editor Tim Danaher.
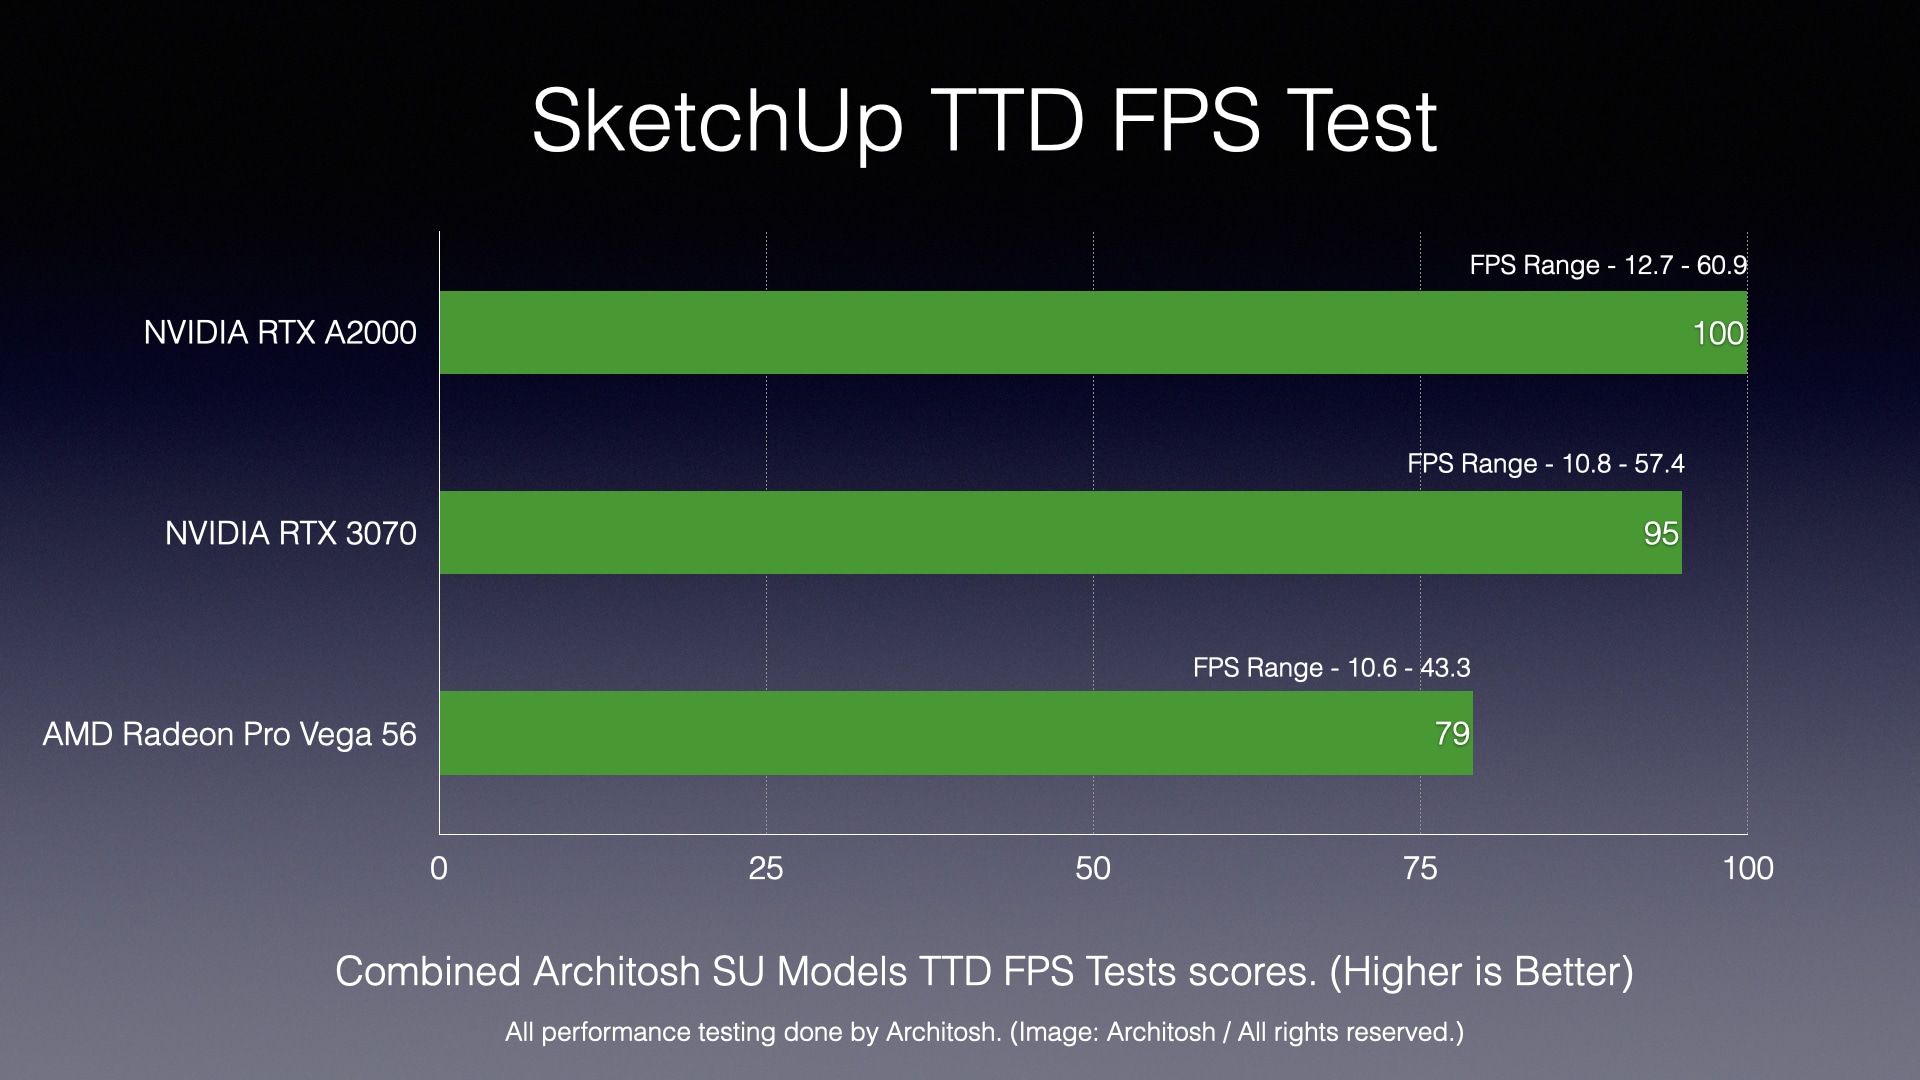
Chart 1 — SketchUp TTD test is a combination (additive) of seven individual SU scene tests across three files. The tiny NVIDIA RTX A2000 actually edged out the much larger with more cores and more memory NVIDIA GeForce RTX 3070. This could be due to the workstation driver on the RTX 2000 versus the game-oriented RTX 3070. All charts except those noted are indicating percentages on the x-axis. Longer Bars are better. (Image: Architosh / All rights reserved.)
For this test, we compared the NVIDIA RTX A2000 against an NVIDIA RTX 3070 that came with our 2021 BOXX Technologies workstation. Since we switched up some of our SketchUp test scenes, we can’t throw in our recent review of AMD’s Radeon Pro W6600, but we add some commentary at the end of this section on that GPU.
Our iMac Pro (late 2017) with an AMD Radeon Pro Vega 56 was thrown in for good measure, but that machine is being affected by a different CPU, motherboard, and even a different operating system. Still, it serves as a reference point.
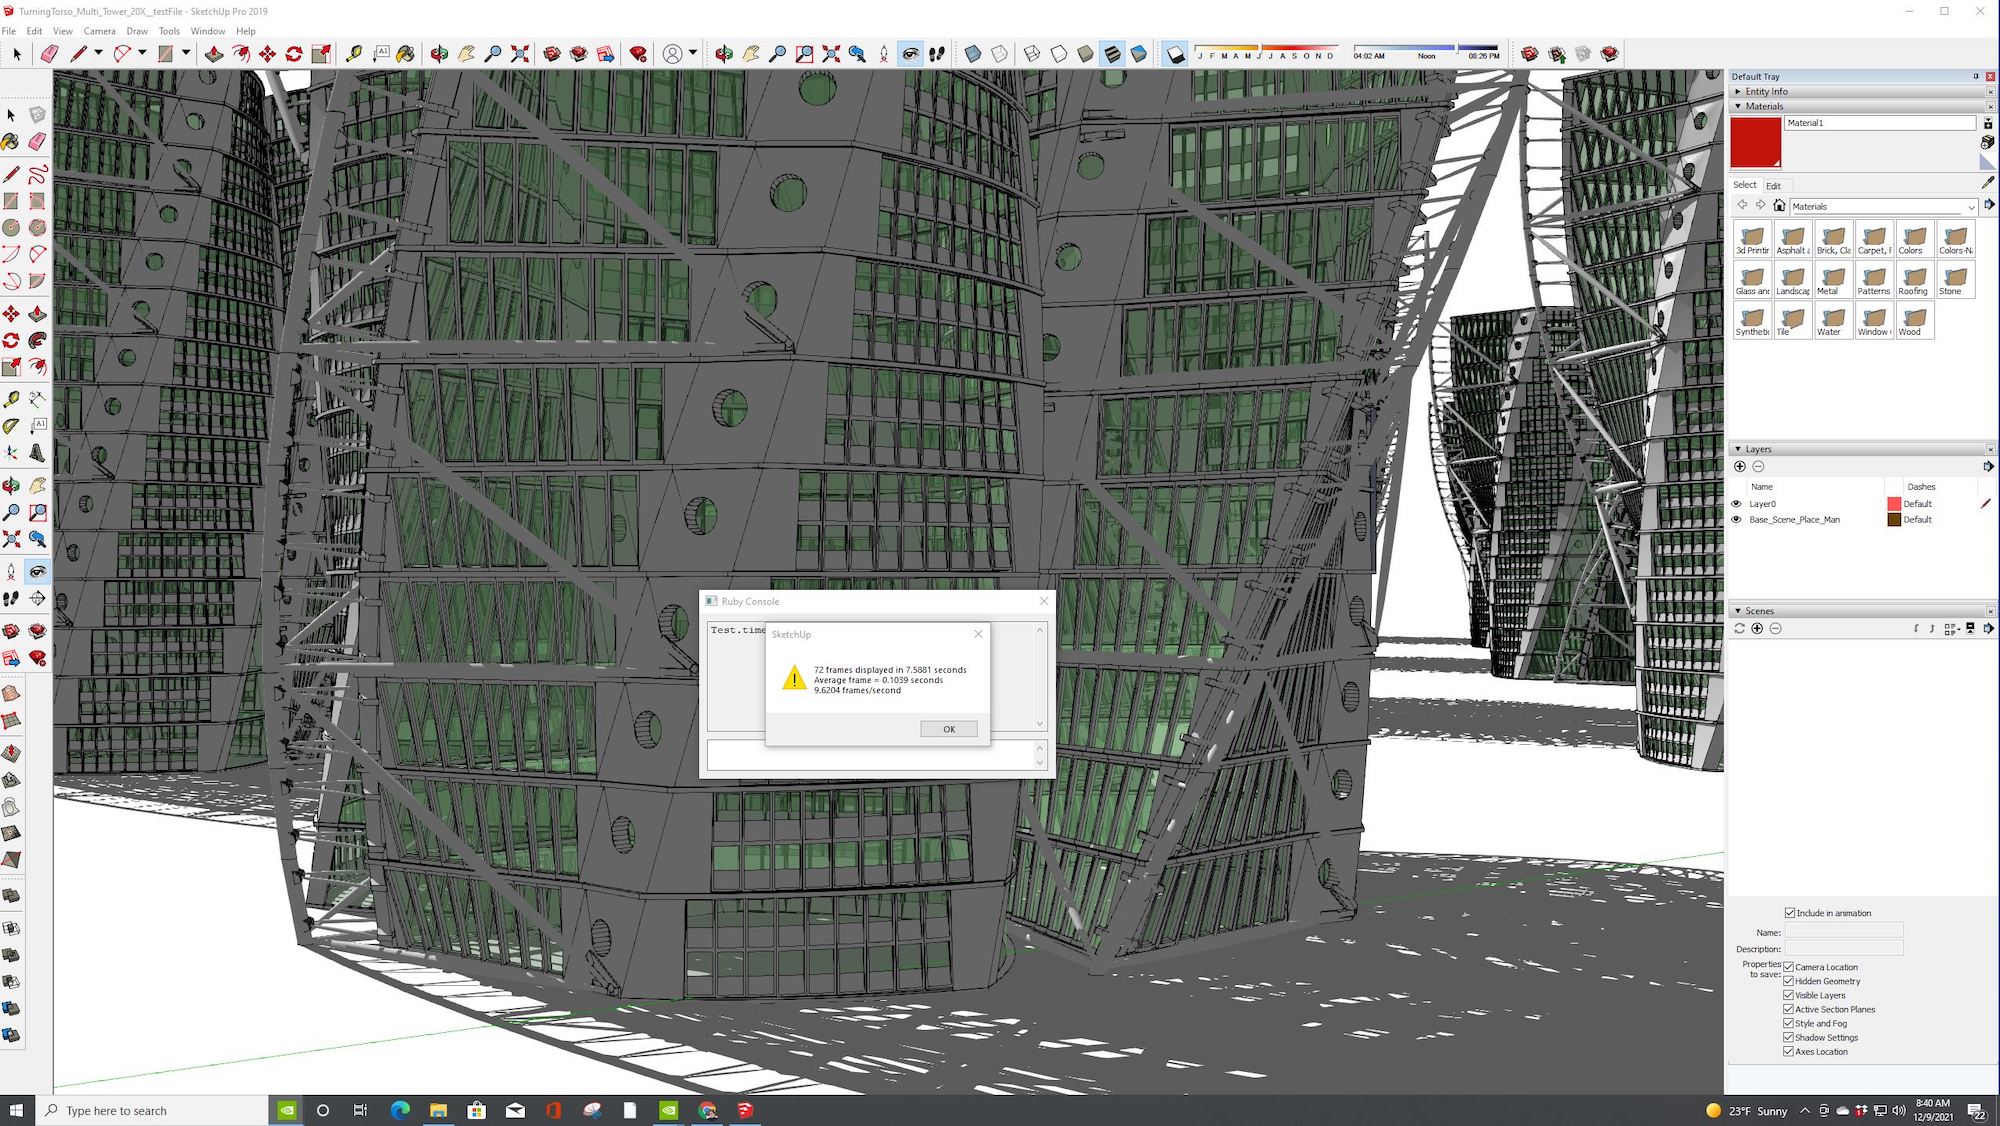
A view of TurningTorso Tower (by Tim Danaher). In this file, we multiplied the tower by 20x. Although our smallest file, by megabytes, this file’s geometry complexities and glazing make it a demanding test file. Much older GPUs show much slower FPS rates.
As you can see below, on the SketchUp tests, the RTX A2000 edged out the RTX 3070, which is a massive GPU compared to the tiny RTX A2000. Essentially, the RTX A2000 delivers a lot of firepower for SketchUp workflows or OpenGL modeling workflows with shaded, textured, and shadowed models.
As for the recently reviewed AMD Radeon Pro W6600, the RTX A2000 put up very similar SketchUp scores across all three of our files. If folks are building a SketchUp-centric workstation, a decision between AMD Radeon Pro W6600 and the NVIDIA RTX A2000 is mute; there is no wrong answer. That answer gets shaped differently if you wish to do rendering and if your tools are optimized for CUDA and RTX technologies, tech that favors NVIDIA. For Revit, Twinmotion, and Unreal Engine, AMD’s new Viewport Boost may tilt the decision the other way. This is simply looking at two recently released offerings within the narrow view of some predominant workflow considerations. There are other popular architecture workflows that don’t include any of those tools just mentioned above, including tools from Nemetschek’s daughter companies.
Perhaps a large point is this when it comes to SketchUp: one doesn’t need much more than either of those two cards if users stay in SketchUp plus 2D CAD applications all day long.
That is still a large segment of the AEC industry, but it is a segment that is changing due to real-time raytraced rendering workflows which is encouraging BIM (adoption) workflows that dovetail seamlessly with tools like Twinmotion, Enscape, Lumion, and V-Ray.
Twinmotion
In our most recent GPU review, we captured data using NVIDIA’s free FrameView tool. We used that tool again to notice FPS inside Twinmotion. For the most part, frame rates were nearly identical to the AMD Radeon Pro W6600 we just reviewed. None of that was surprising given the closeness these two cards faired in some benchmarks below. In general, Twinmotion performance under the NVIDIA RTX A2000 was quite good and the visual quality was excellent. We operated under ‘ultra’ settings crossed the board and the application never stuttered visually as we moved within scenes or did sudden camera turns.
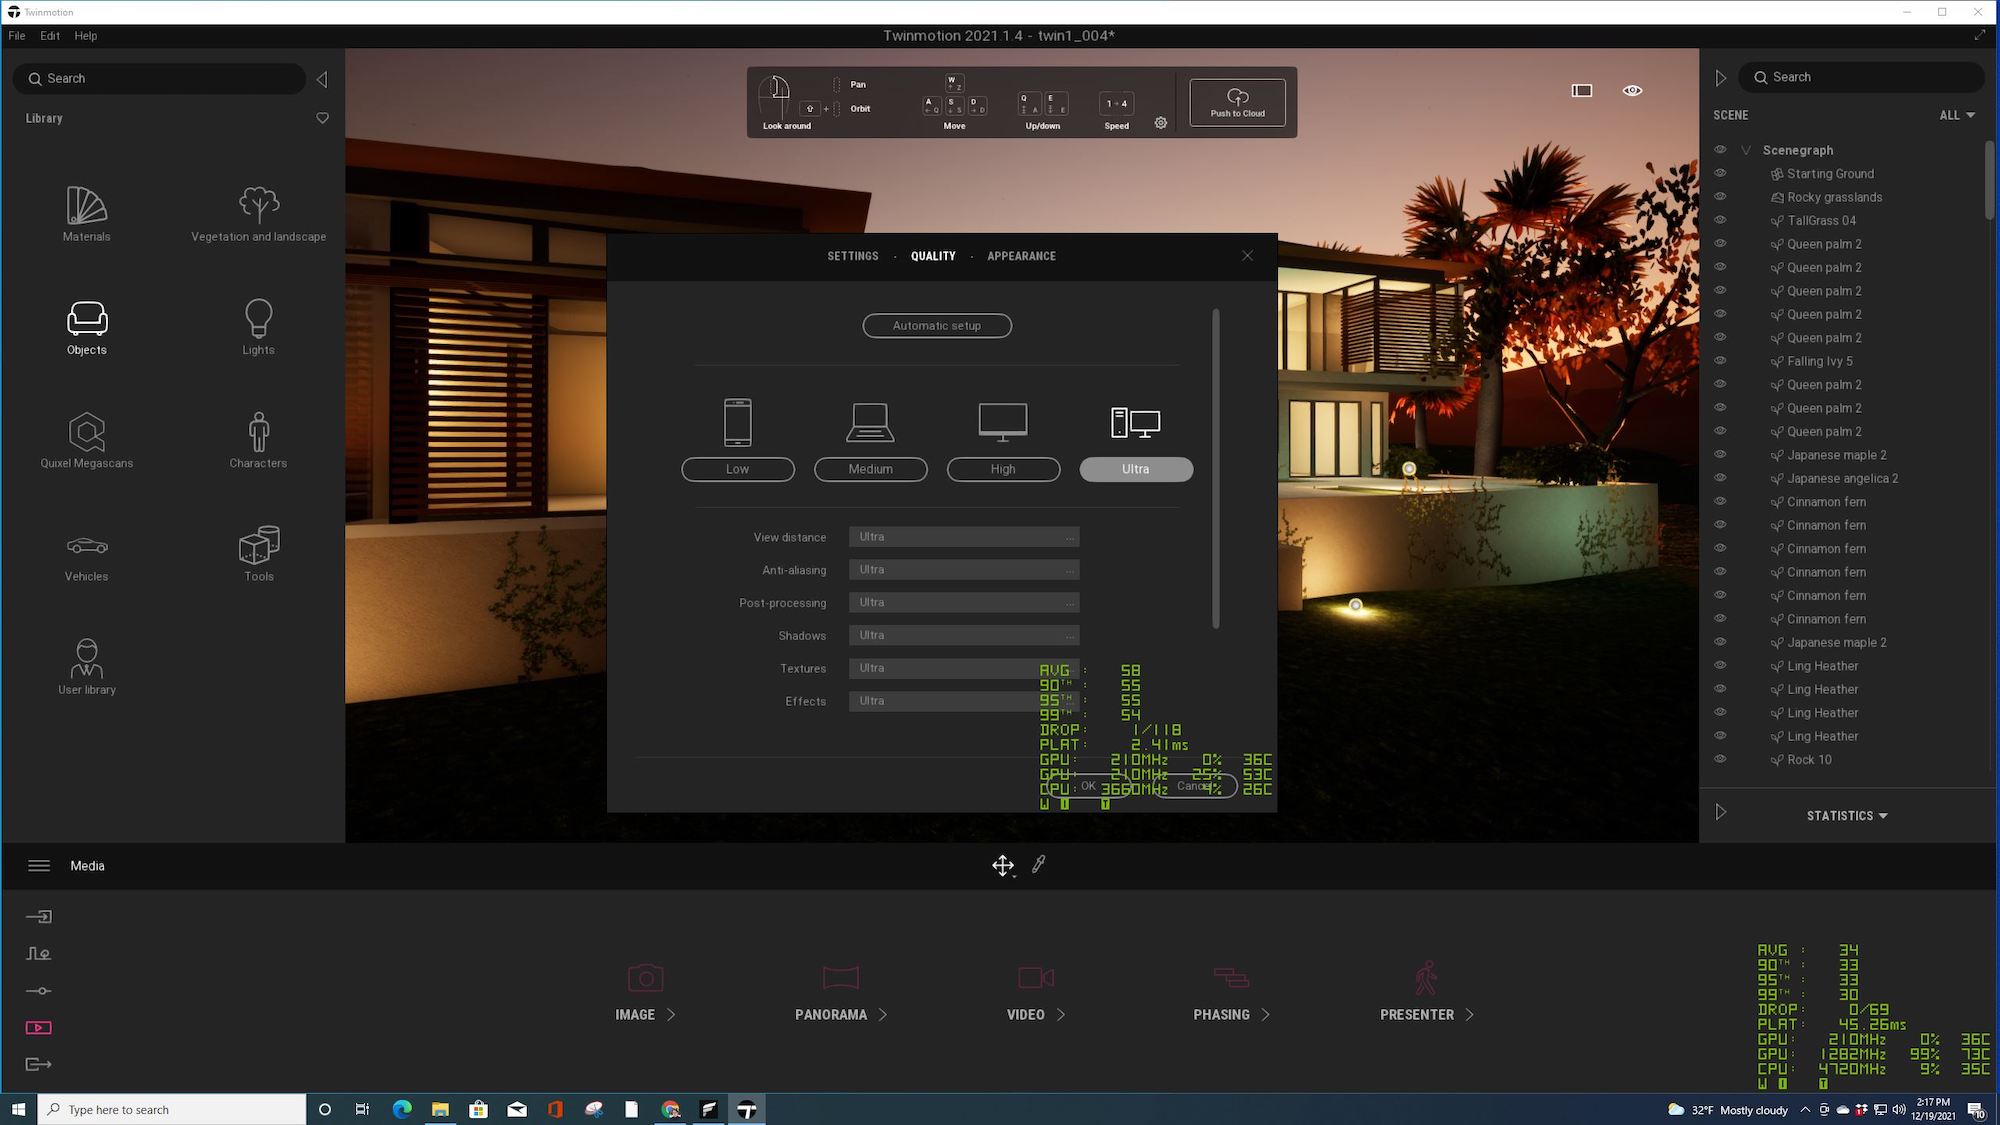
Twinmotion settings window in our test file. (Image: Architosh / All rights reserved.)
We only mention the AMD card because we recently reviewed it. One can’t compare the AMD Radeon Pro W6600 against the NVIDIA RTX A2000 straight out on performance alone; they are different cards with different use cases and different technologies on the software-to-hardware side. The W6600 cannot fit inside SFF workstations and the RTX A2000 does not have unique tech like Viewport Boost aimed at Revit and Twinmotion.
CompuBench
This benchmark is focused on GPU compute, but the algorithms in the selected tests are very applicable to real-world advanced professional 3D computer graphics. We ran the Catmull-Clark (Pixar) SubDivision surface level 5 test, and we also ran the Subsurface Scattering rendering test. These tests ran using OpenCL, though, on NVIDIA GPUs, you can run them under CUDA. We will get to CUDA in a moment, but OpenCL test scores allow us to compare GPUs on this benchmark across operating system platforms and among AMD versus NVIDIA GPUs. There are over a dozen excellent GPU compute tests on this benchmark, but we focus on a rendering test and a SubDivision test.
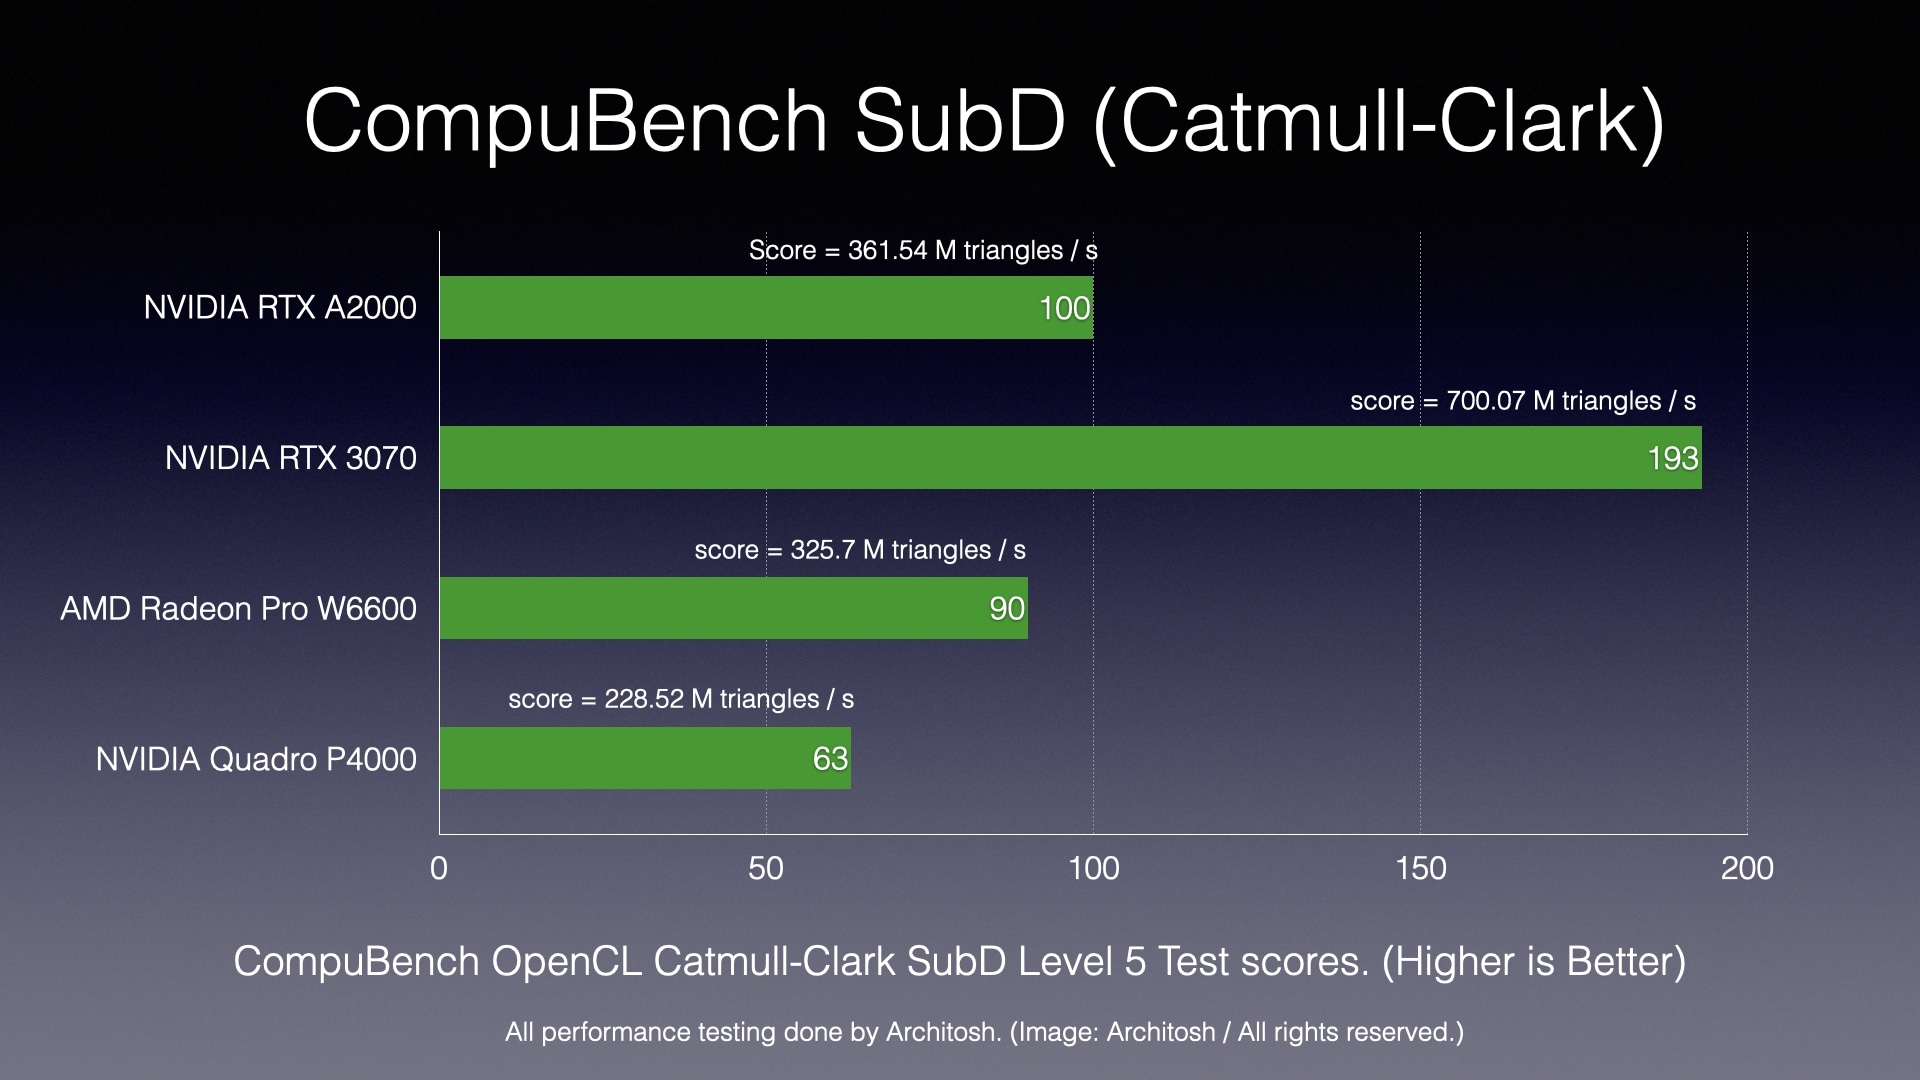
Chart 2: CompuBench Catmull-Clark SubDivision Test using OpenCL. Longer bars are better. (Image: Architosh / All rights reserved.)
As you can see, we also compared the NVIDIA A2000 GPU to the recently tested and W6600. But the key reference point is the NVIDIA RTX 3070 that shipped with our BOXX testing rig.
The NVIDIA RTX A2000 has 3,328 latest generation CUDA cores, compared to the NVIDIA RTX 3070, which has 6,144. With essentially double the GPU compute cores, we can safely assume double the GPU compute performance. Compared to reference scores on the NVIDIA Quadro P4000 (which we also used in our Radeon Pro W6600 review for a reference point), the RTX A2000 is about 40 percent faster on this particular measure.
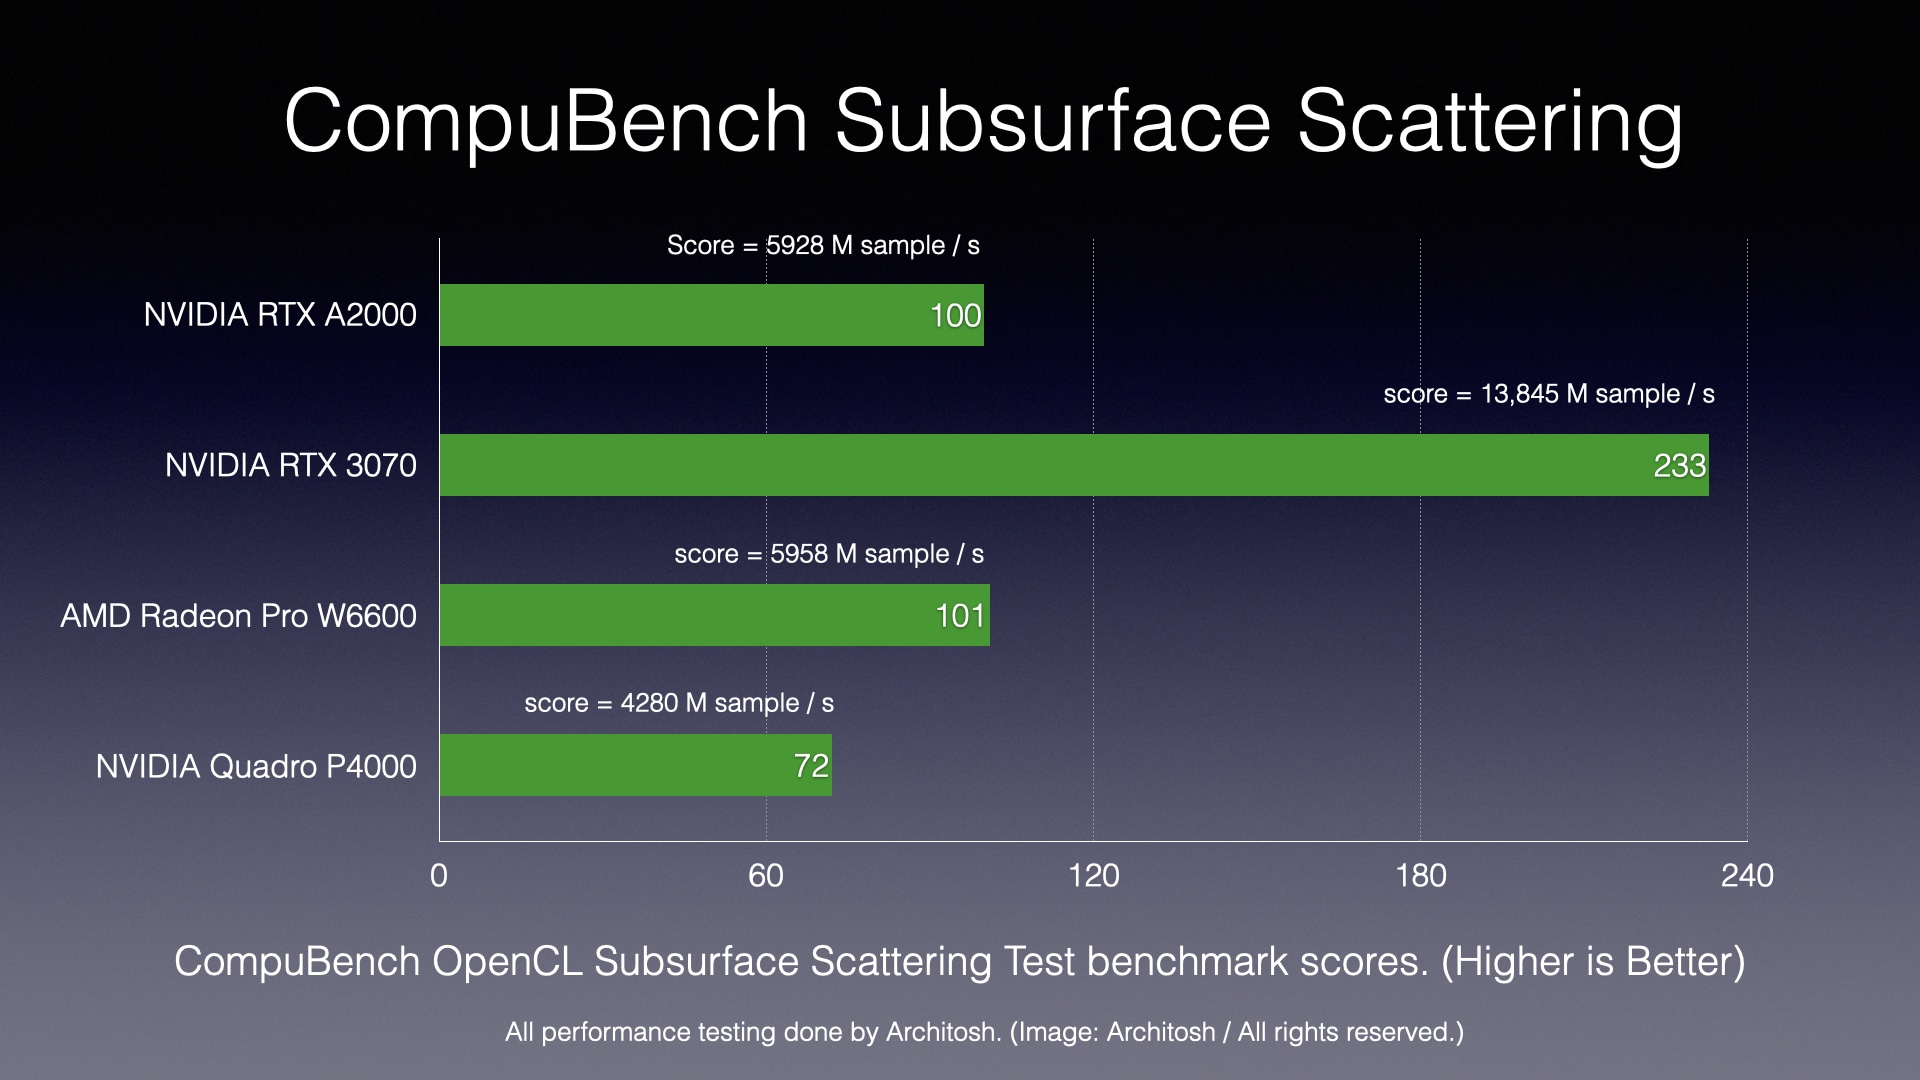
Chart 3: CompuBench Subsurface Scattering Rendering Test using OpenCL. Longer bars are better. (Image: Architosh / All rights reserved.)
On the Subsurface Scattering Rendering tests we can see less of a margin between NVIDIA RTX A2000 and our reference Quadro P4000. As we noted above, the comparison between AMD Radeon Pro W6600 and RTX A2000 is fairly tight. The latter card seems to have some advantage with tessellation calculations. And in both tests, the much larger GPU (RTX 3070) with double cores and more memory helps explain scores.
GFXBench Tessellation (OpenGL)
We ran only the Tessellation and Texturing OpenGL tests from GFXBench for the RTX A2000 benchmarking. While DX11, DX12, and Vulkan are also graphics API choices for GFXBench, we focus on OpenGL on this particular test because most 3D CAD applications are still OpenGL based. This is especially true for cross-platform tools like Sketchup and many if not most MCAD tools.
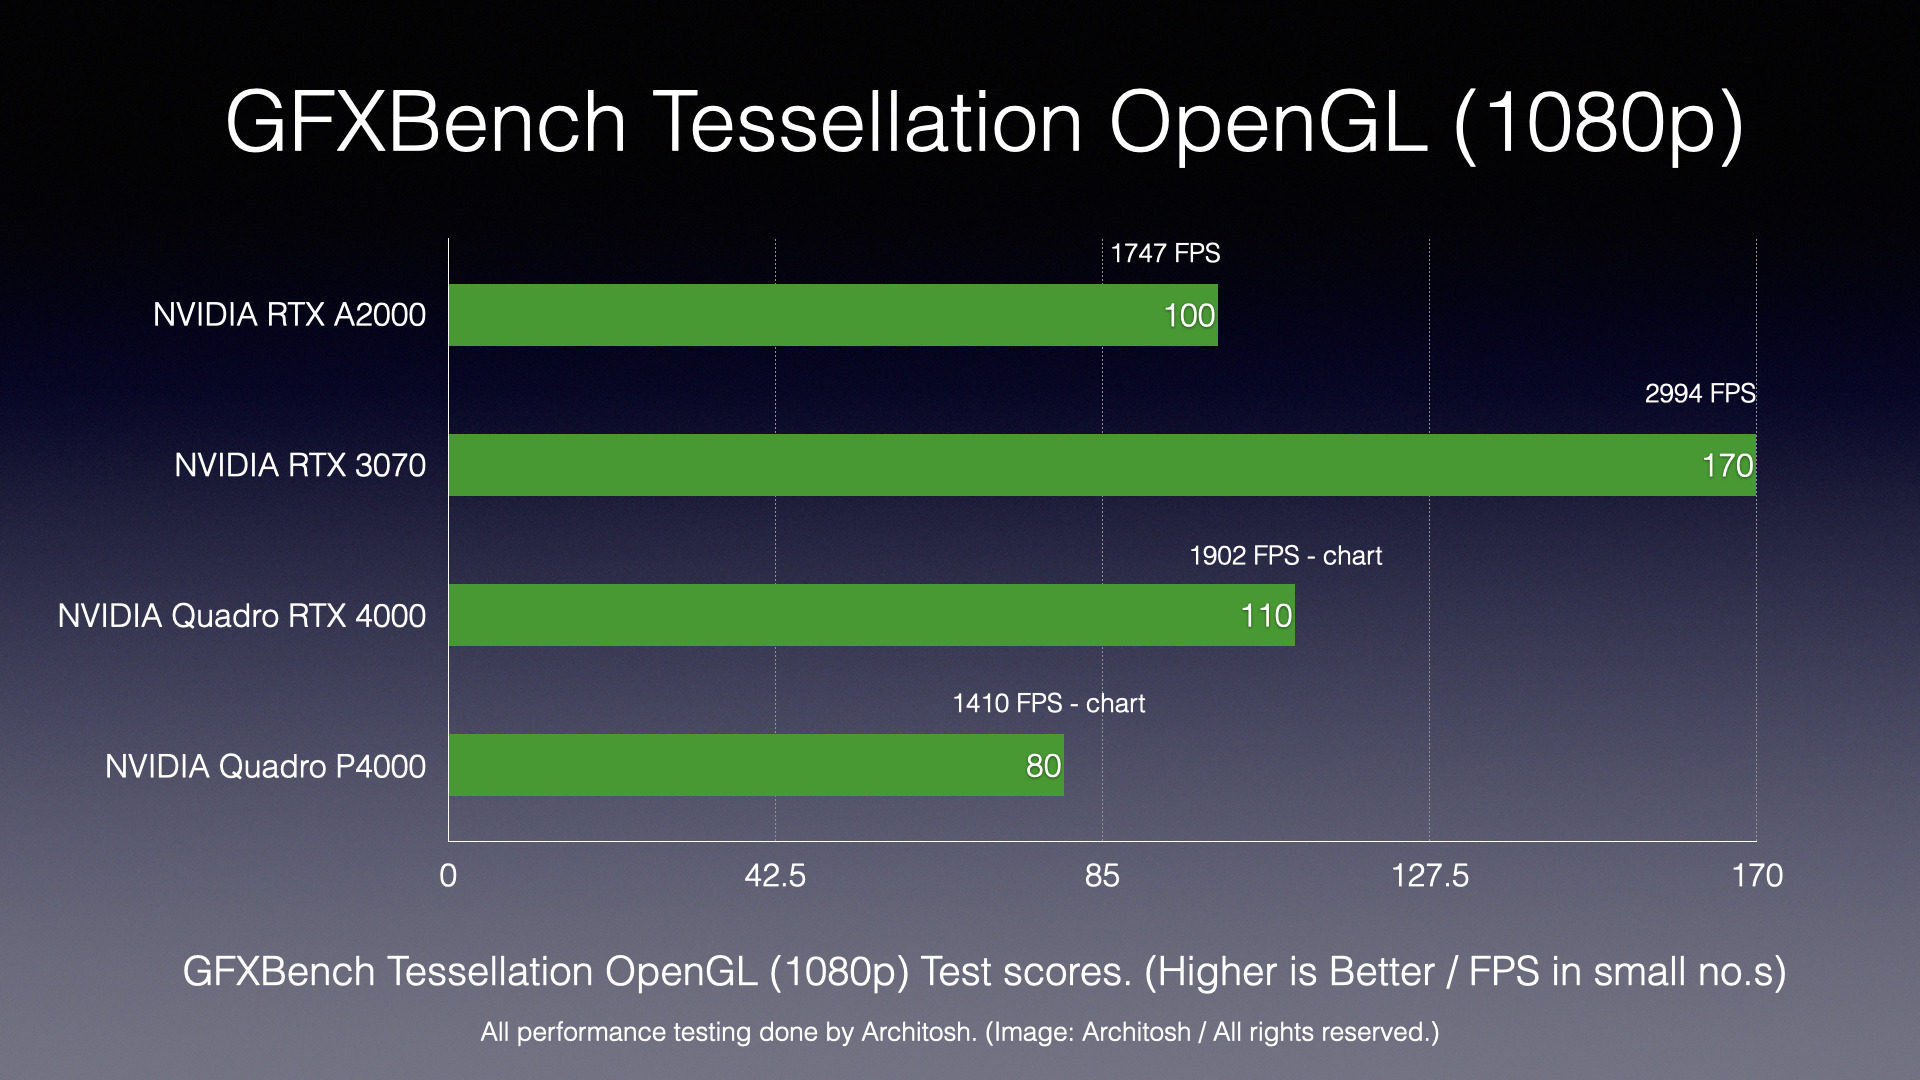
Chart 4: GFXBench Tessellation OpenGL Test. Longer bars are better. (Image: Architosh / All rights reserved.)
Tessellation is a critical technology in OpenGL performance and real-time rendering. Datasets of polygons are tessellated into triangles, and the process is offloaded onto GPU hardware to enable the smoothing of objects in real-time.
On this test, the RTX A2000 lands mid-way between the performance of the NVIDIA Quadro P4000 (pre-Turing Architecture) and its Turing successor, the NVIDIA Quadro RTX 4000, products that are true mid-level workstation GPUs, not entry-level like the RTX A2000. On a dollar basis, the RTX A2000 shines, delivering 3.3 – 3.8 FPS compared to the Turing generation Quadro RTX 4000, which was 2.12 FPS.
GFXBench Texture Fill-Rate (OpenGL)
This test approximates the texturing load of the GFXBench Manhattan high-level test by rendering multiple layers of texture. It is a fill-rate test. The test measures how many pixels (texels) the GPU can render per second.
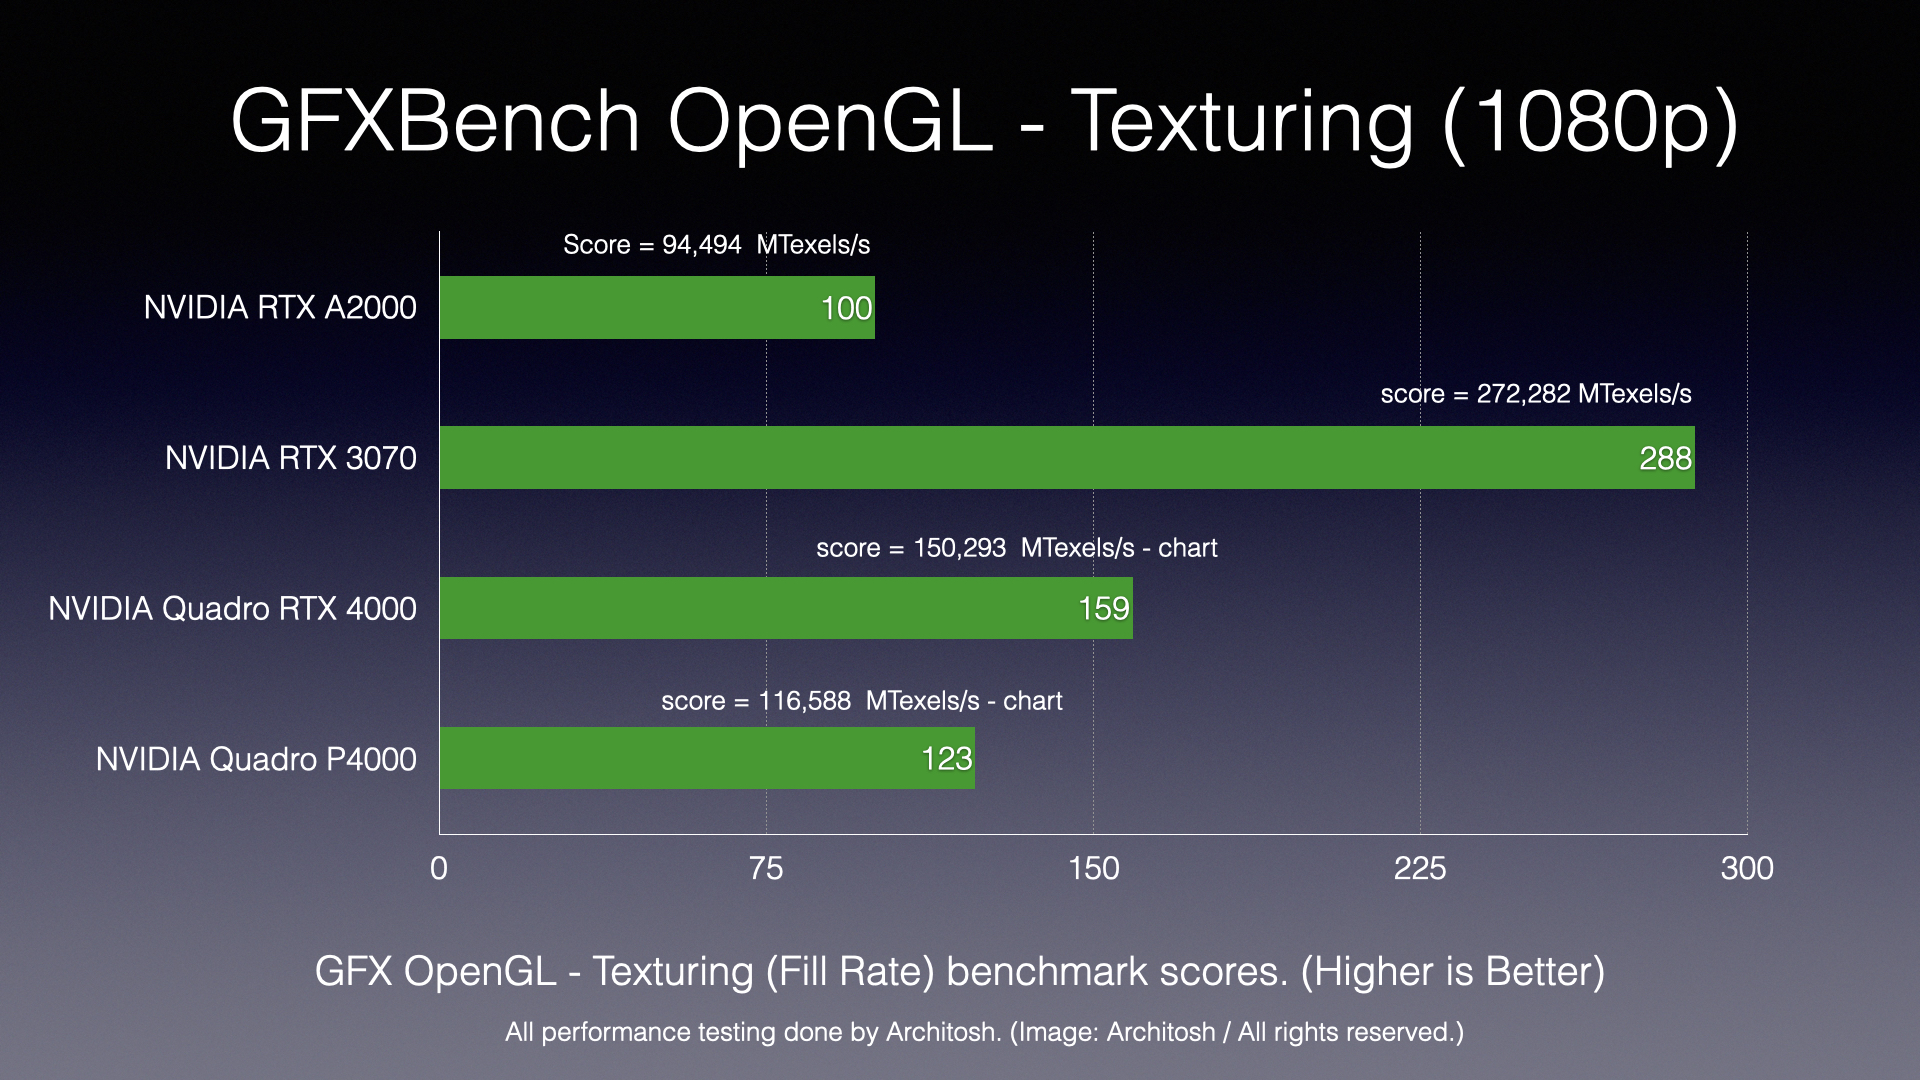
Chart 5: GFXbench Texture Fill-Rate Test. Longer bars are better. (Image: Architosh / All rights reserved.)
Traditionally, the texture fill rate is equal to the GPU’s core clock rate x TMUs (texture mapping units). The gamer-oriented RTX 3070 has 184 texture mapping units and a core clock speed of 1500 Mhz. The RTX A2000 has 104 texture mapping units and has a core clock speed of 562 Mhz. This explains the big difference. Where texturing fill rates are nearly triple on the high-end gamer card, when it came to tessellation (arguably a more CAD-centric measure), the RTX A2000 shines for its size, on both OpenGL and OpenCL APIs.
VRMark
NVIDIA says the RTX A2000 is a VR-ready capable GPU. We used the excellent VRMark to test it, and the results were interesting. We specifically tested it against the NVIDIA RTX 3070 (a popular gamer’s GPU) that came with our Boxx test rig unit.
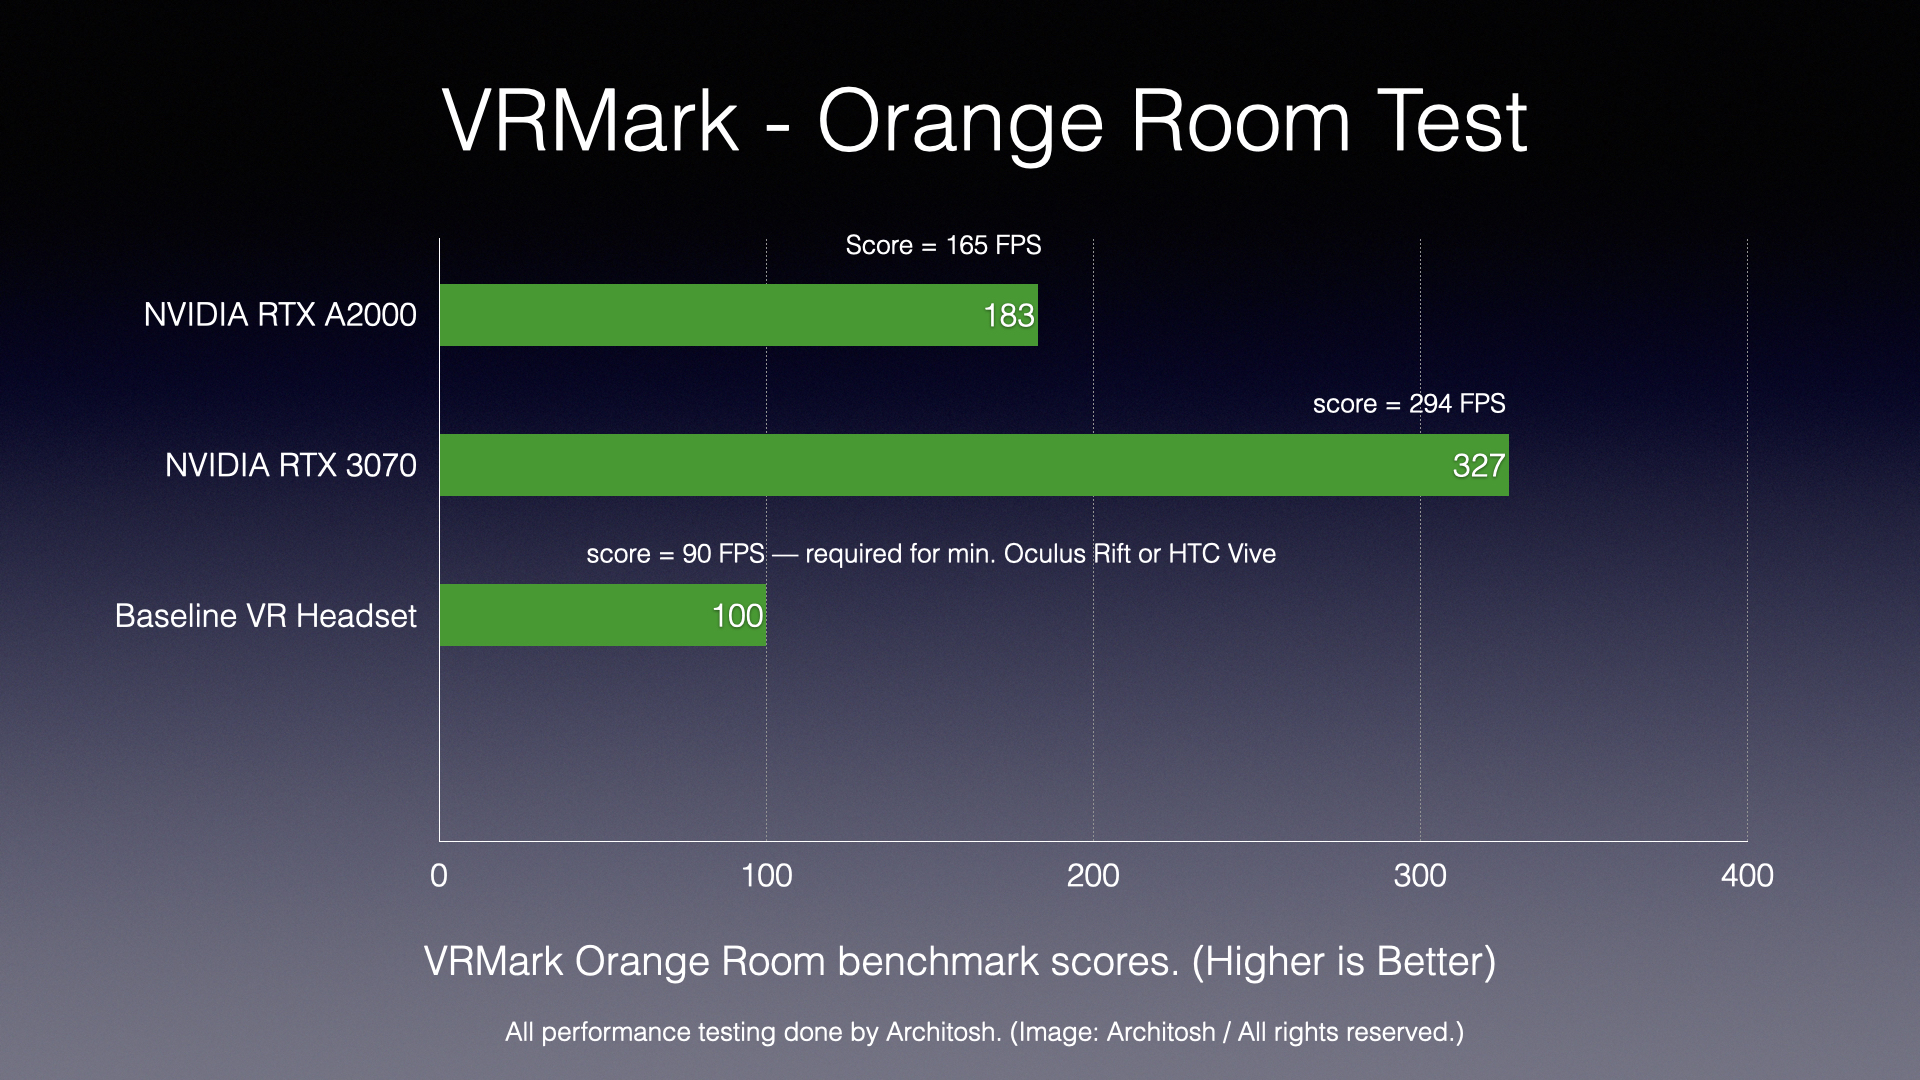
Chart 6: VRMark scores for the RTX A2000 show that the tiny workstation entry-level GPU more than meets the requirements for VR headset hardware. Longer bars are better. (Image: Architosh / All rights reserved.)
VRMark has three tests but we focused on the Orange Room. The Orange Room tests for GPU compatibility for HTC Vive and Oculus Rift. Typically these headsets have a minimum frame rate spec requirement of 90 FPS. The RTX A2000 scored 165 FPS, efficiently meeting the needs for VR headsets.
V-Ray 5 Benchmark (RTX and CUDA)
Chaos’ V-Ray rendering technology and applications and plugins have long set a gold standard in the AEC rendering arena. V-Ray, now at version 5, is extremely popular with the best archviz artists on the planet. The company also makes available a free benchmarking tool called V-Ray 5 Benchmark. The application has three tests, one of which focuses on the CPU and is ignored in this case. The GPU RTX test and the GPU CUDA for GPU tests are the tests we did for this review.
We simply focused on comparing the RTX A2000 to our RTX 3070 GPU. While we knew in advance the high-end gamer-oriented GPU would defeat the entry-level workstation GPU, we get a good sense here by how much. Additionally, we provide some performance per dollar metrics below, which are important to the essence of the RTX A2000 GPU.
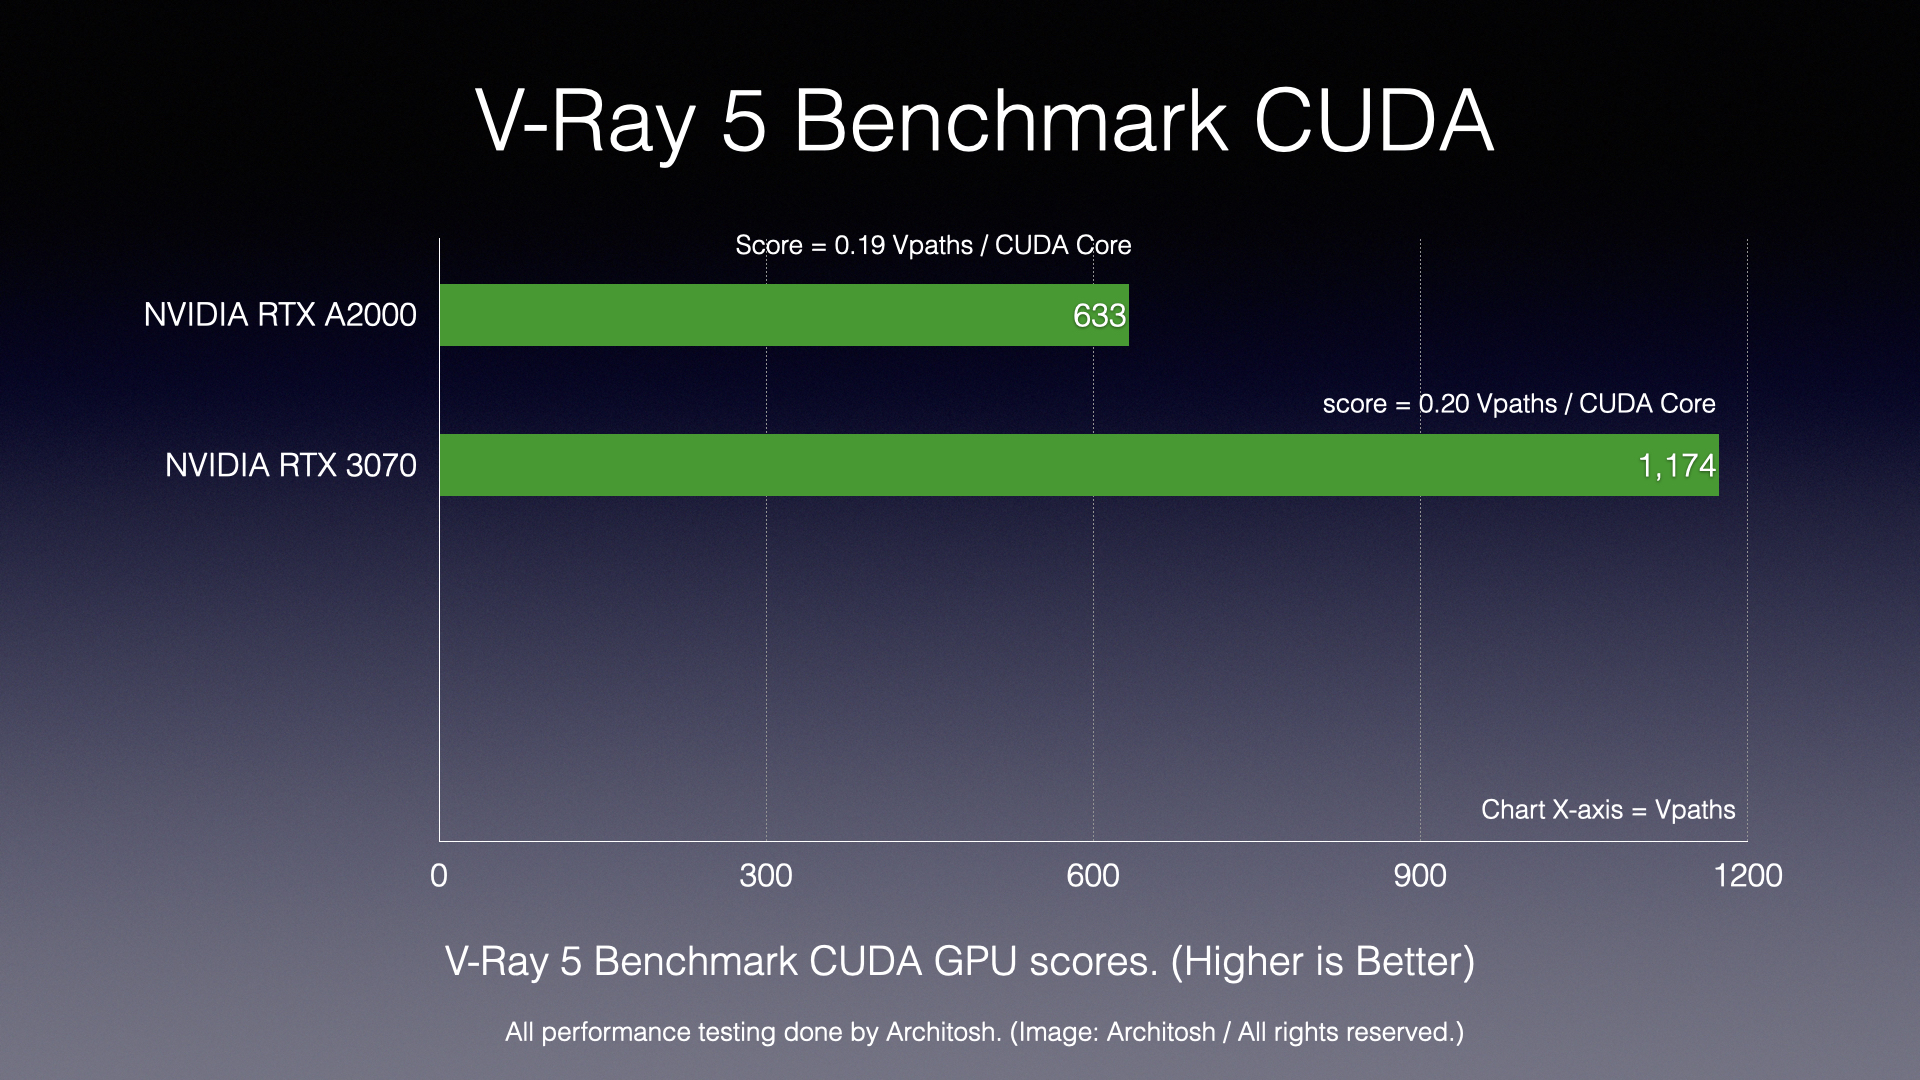
Chart 7: V-Ray 5 Benchmark — GPU CUDA Test. Longer bars are better. The x-axis is Vpaths, not percentages as in all other charts above. (Image: Architosh / All rights reserved.)
On the GPU CUDA test, we see that the RTX A2000 performs at about 54 percent of the RTX 3070. The latter card has many more CUDA cores. The values above the green bars in the chart show the number of Vpaths calculated per CUDA core in each GPU. In the case of the RTX A2000, it generates 0.19 Vpaths per CUDA core, compared to the RTX 3070 which generates 0.20 Vpaths per CUDA core. In essence, both of these Ampere generation GPUs are equal at the CUDA performance level on a per-core basis. At least on this test. The difference comes in cost (see below).
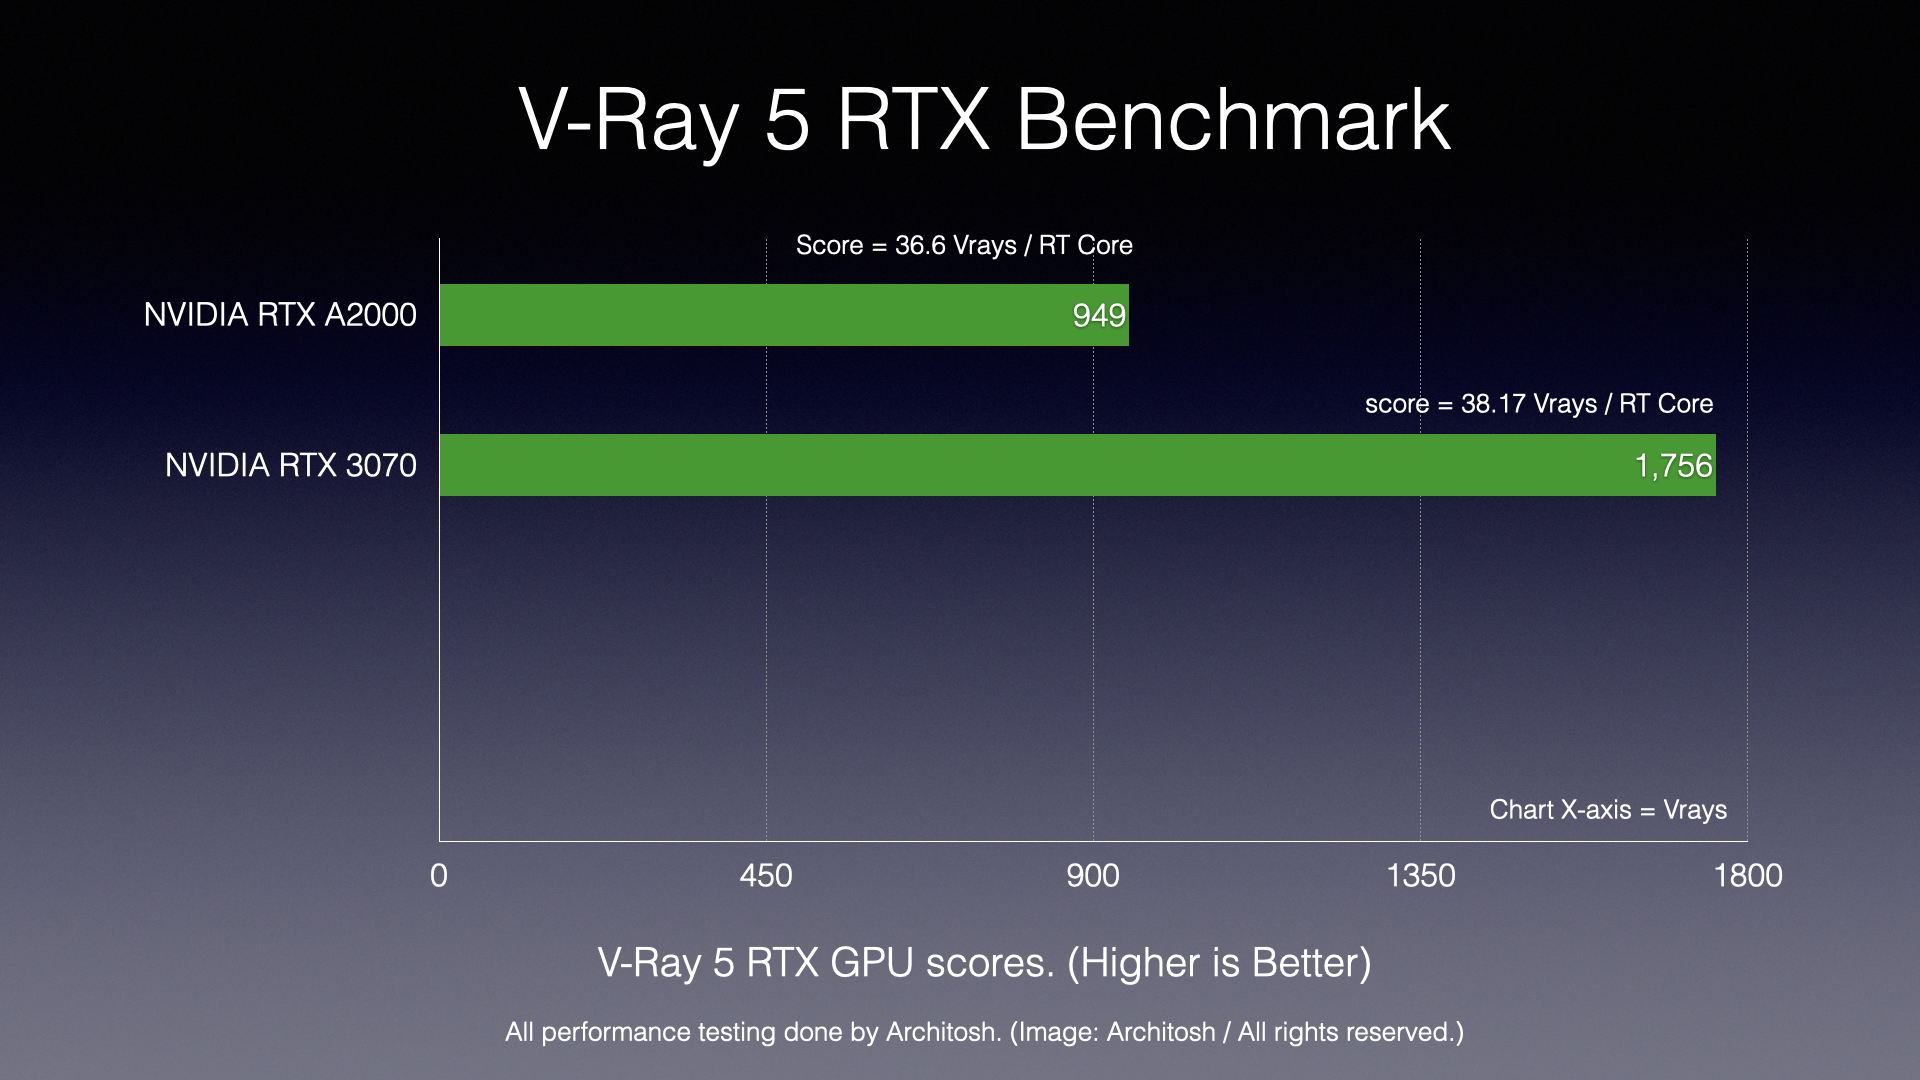
Chart 8: V-Ray 5 Benchmark RTX GPU Test. Longer bars are better. The x-axis is Vrays, not percentages as in the charts above. (Image: Architosh / All rights reserved.)
On the RTX GPU test, similar results happen, again noting the delta between the two GPUs on the number of RT cores they both have. For the RTX A2000, it scores 36.6 Vrays per RT core, slightly behind 38.1 Vrays per RT core on the RTX 3080.
Conclusions and Recommendations
Performance Analysis
Technically, we have compared the NVIDIA RTX A2000 against the recently reviewed AMD Radeon Pro W6600 and an NVIDIA RTX 3070 on the same BOXX Technologies workstation. We have also compared results to published chart data for two generations of mid-range workstation-class GPUs—Quadro P4000 and Quadro RTX 4000. And just for another reference point, we compared an AMD Vega 56 inside our iMac Pro (2017).
In real-world apps, the NVIDIA RTX A2000 offered excellent performance. For the zillions of architects and designers out there working in SketchUp and pairing that app to real-time rendering solutions like Enscape and Twinmotion, the A2000’s ability to fit into Small Form Factor (SFF) workstations is a huge benefit for the GPU.
We also like the RTX A2000’s tessellation scores. For surface and solids modeling in CAID and MCAD workflows, the tiny GPU offers excellent performance, almost matching a Quadro RTX 4000 in OpenGL tessellation performance. The VRMark score demonstrates that despite its tiny size, the RTX A2000 can power most VR headsets. For those interested in Varjo’s industrial-grade VR-3 / XR-3 headsets, and above, the NVIDIA RTX A2000 doesn’t quite fit the bill. NVIDIA’s new RTX A2000 isn’t aimed at the high-end market where Varjo’s gear plays.
For V-Ray users, the RTX A2000 generates 1.8 – 2.1 Vrays per USD, compared to 1.95 Vrays per USD for the RTX 3070. On the OpenGL tessellation level, the RTX A2000 is an even better value performer. The variability in the 1.8 – 2.1 Vrays measure depends on if users can grab an A2000 for USD 450 or the USD 525 we saw online. Sometimes folks automatically think that getting the least expensive option among a selection of options means you get less dollar value. In this particular case, the A2000 delivers excellent value.
Recommendations
NVIDIA purposely focused on delivering an entry-level workstation-class GPU in the RTX A2000, and one that is so tiny in size it can fit inside SFF workstations, which abound in many AE firms. The smaller workstations are popular because they save space. The RTX A2000 packs a punch for its tiny size and it delivers an industry first in hardware-accelerated real-time raytracing (RTX technology) aimed at tiny workstations. Given the SFF fit for the AEC market, the real-time raytracing, and the performance per dollar, the NVIDIA RTX A2000 looks to be a popular hit in the CAD market.
Pros: Excellent performance per dollar for an entry-class workstation GPU; offers real-time raytracing support with second-generation RT cores in a tiny GPU set for SFF workstations. The GPU has superb tessellation performance per dollar. The A2000 brings RTX technology down to the lowest tier in NVIDIA’s workstation lineup for the first time. The GPU can fit into standard-sized computers just as simply as SFF machines. There is a large array of CUDA-accelerated and RTX pro apps in existence.
Cons: The tiny fan on the unit isn’t silent. The fan noise is minor but it is present. The noise will vanish in a multi-person office environment but will be noticed in a home office.
Advice: For SFF workstation and desktop computer users, the RTX A2000 will bring you RTX-based real-time raytracing and excellent performance for the price.
Costs: 450 USD MSRP
![]()

Notes Section
On SketchUp Testing
Built around OpenGL 3.1, your GPU, along with the CPU, powers what you see in the SketchUp viewport (your viewing and modeling space).
In the simplest terms, the CPU handles geometry (triangulating your 3D model), and the GPU runs raster effects. Panning, Zooming, and Orbiting operations all leverage your GPU and benefit from a good one. Trimble is a bit shy about discussing SketchUp and hardware but their recommendations are here.
Trimble has shared on their user forums a simple FPS (frames per second) test you can run in the SketchUp Ruby Console. You can use it to performance test your system for SketchUp performance.
Simply typing “Test.time_display” into the Ruby Console and hitting the Return key will spin the loaded model scene in a pre-determined, 365 degrees across 72 rendered frames. The result is a “frame rate per second” number (or how fast it rendered all 72 frames in the animation it produces). It doesn’t matter any SketchUp file will perform in this test. SketchUp does manage viewport performance via a technique called “viewport degradation” and thus it will drop out image quality items if the test cannot spin the model while maintaining the viewport’s image settings (eg: shadows turned on, fog turned on, etc)
In our three test files, we do not have shadows turned on for the two smallest of files (1.3MB and13MB) but not for the 200MB garden and house file. One TurningTorso 1x file does not have shadows turned on.
Using system monitoring tools, in the past, we have experienced GPU utilization rates as high as 80 percent at peaks, but generally, we see things peak around 30 – 60 percent GPU utilization.
We use three core files ranging in size from 1.3, 13, and 200 megabytes. You can learn a bit more by reading our review of the AMD Radeon Pro W6600 here.