There are few chores architects dislike less than measuring existing buildings by hand. And by hand, I am referring to sending out a couple of staff from the office with a tape measure and a few pads of paper. It’s one of those things I recall doing myself quite thoroughly many times in the youngest days of my architecture career and just about the only good thing about it is maybe the idea of getting outside the office for a change, enjoying the weather, or possibly a nice drive to an interesting location. Once on the site, however, the task of measuring an existing building this way involves a minimum of two people to properly tighten a roll-up (flexible) measuring tape accurately or even hold a metal roll-up tape across larger spans. The truth is, it’s just plain hard to measure a building by yourself…there are real limitations.
The truth is, it’s just plain hard to measure a building by yourself…there are real limitations. And problems with accuracy.
Within this context, I was deeply intrigued when I first learned about the folks at OrthoGraph, in Hungary, and have been wishing to thoroughly review their self-named iOS app.
Welcome OrthoGraph I with the Leica Disto D2
OrthoGraph I by itself would still require a handheld tape measure but it would forego the need for a pad of paper and a pen. Working this way wouldn’t solve several issues in “analog mode” building measuring but it would lessen the overall workload by enabling a process that helps you go straight to CAD and BIM from the completed survey work. Working this way you simply launch the OrthoGraph I mobile app on your iPad or Android tablet or, if you are so inclined, your smartphone.
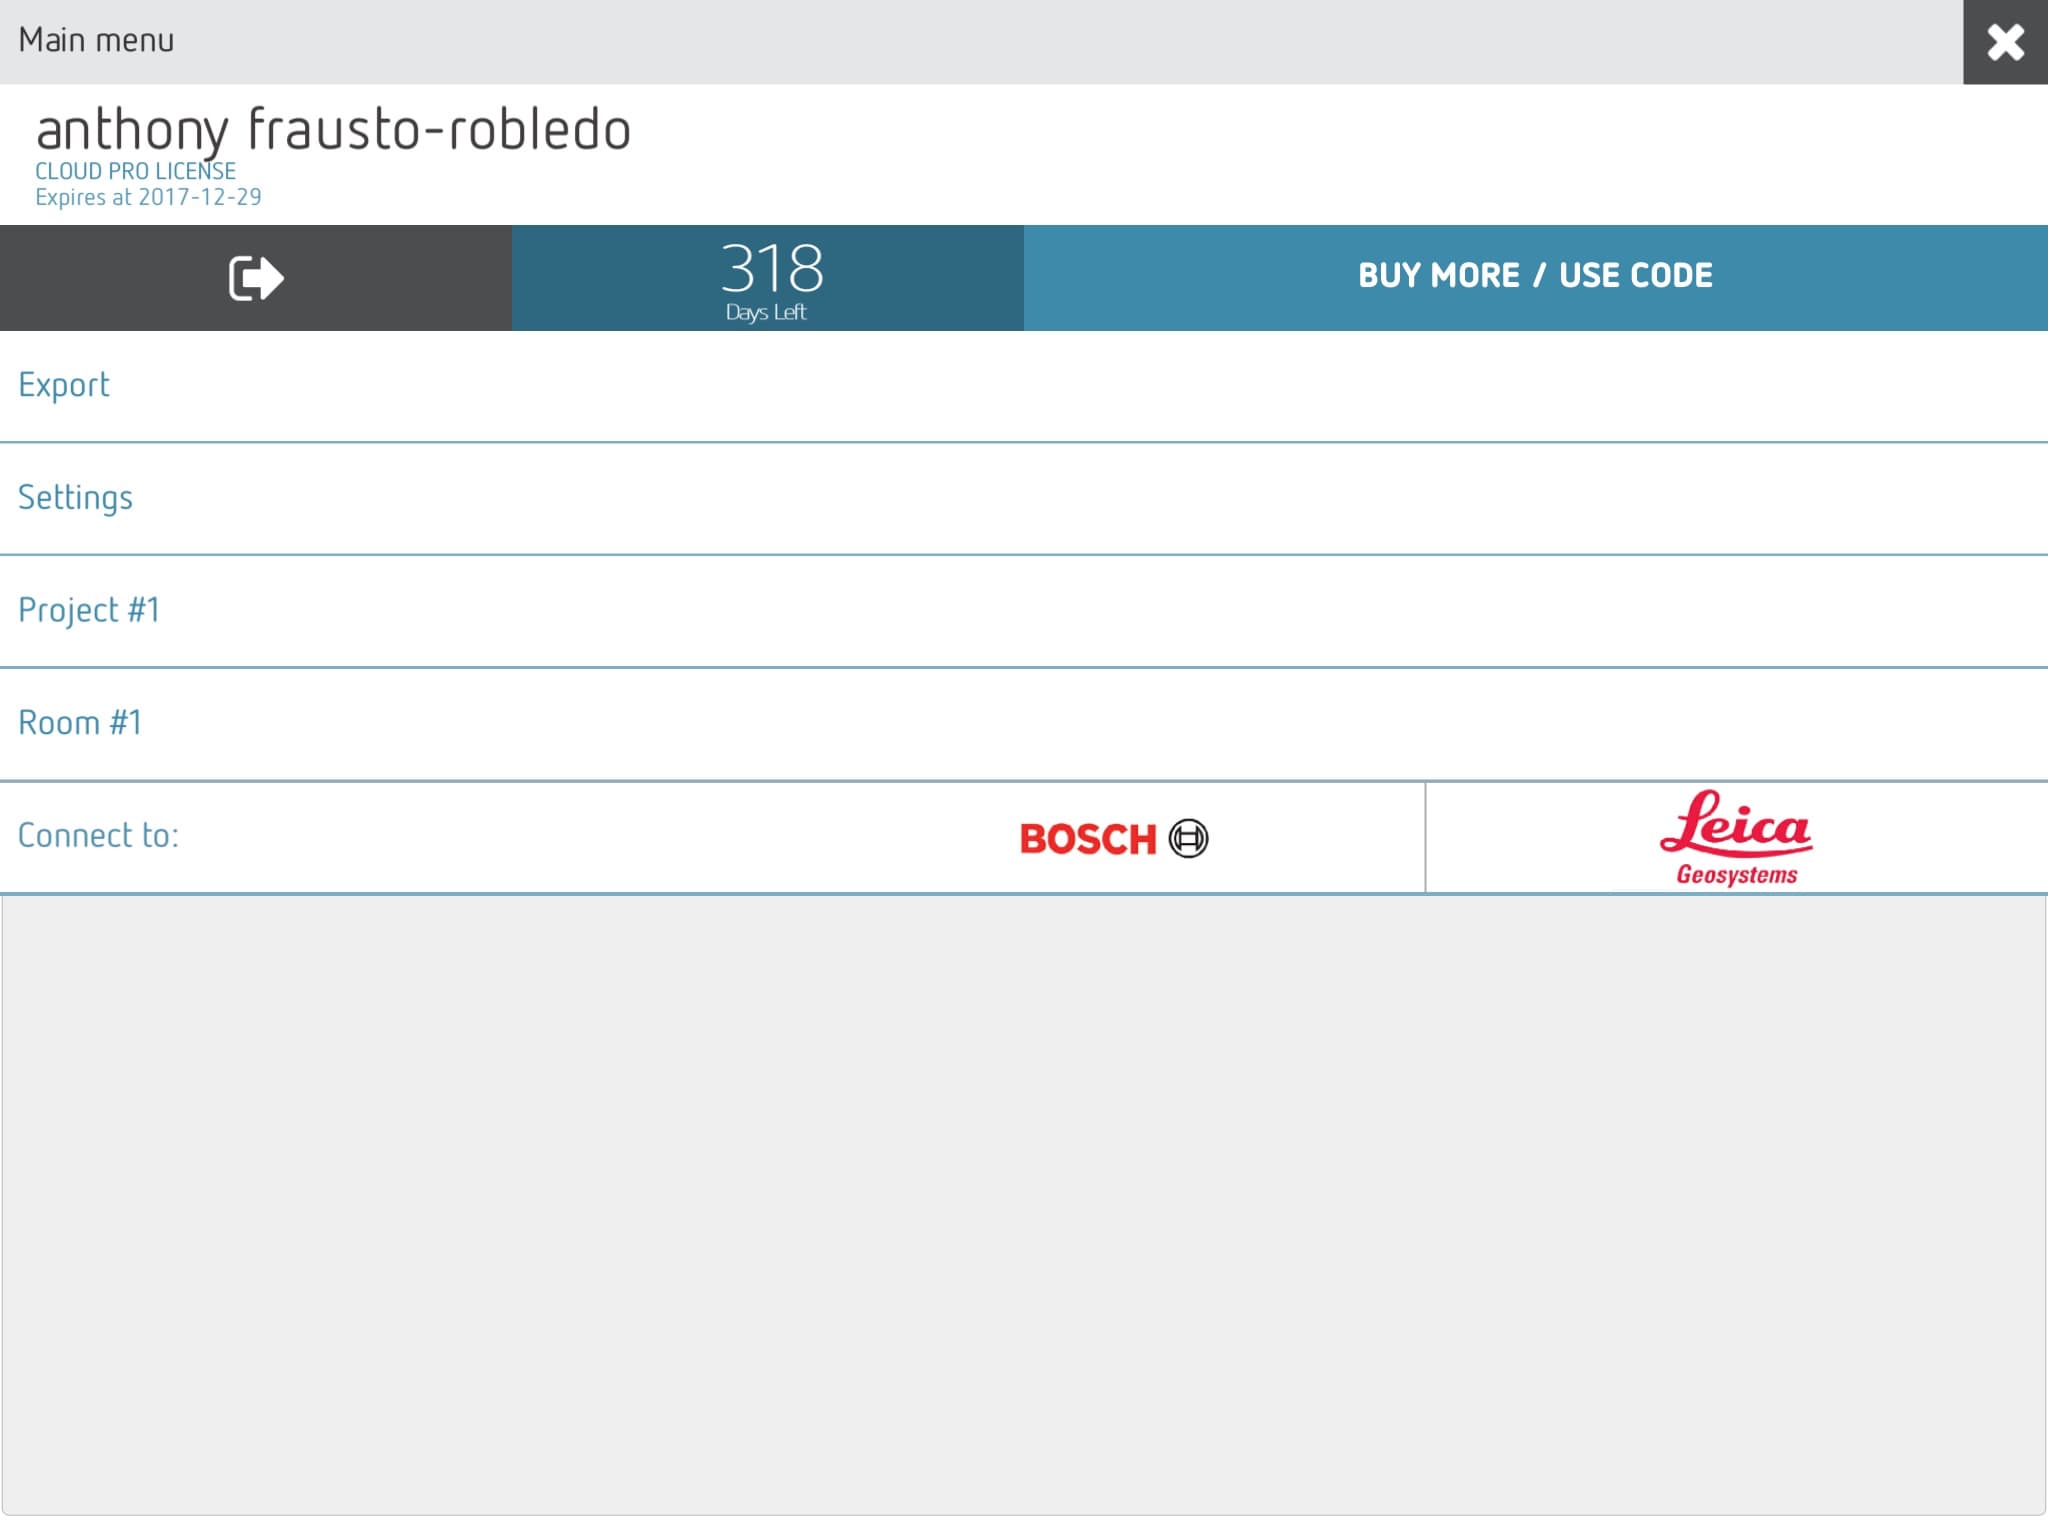
01 – OrthoGraph I’s main menu screen looks like this. Here you control app settings, do exports of your work, acces projects/rooms, and connect to LDMs.
The ideal setup for OrthoGraph I is a tablet working with a laser distance meter (LDM) and while the software works with nearly 10 different devices the most affordable device is the Leica Disto D2, which this author purchased for the purposes of this review. Working with the D2 via the application is quite charming and effective but there can be some learning lessons to get everything working properly and I’ll cover those a bit later in the review.
Installing and Setting Up OrthoGraph I
Installing OrthoGraph I is a rather straightforward process once you access the mobile application from, in my case, the Apple App Store. Acquiring the license enables OrthoGraph I to communicate with the cloud-based services associated with this application. With the license installed the “Main menu” screen shows your account, days left in your license activation, a “Buy More / Use Code” and a upload connection button which enables the sign-in process to the OrthoGraph Cloud system. This is where you would go to log back into the system. (see image 01 above)
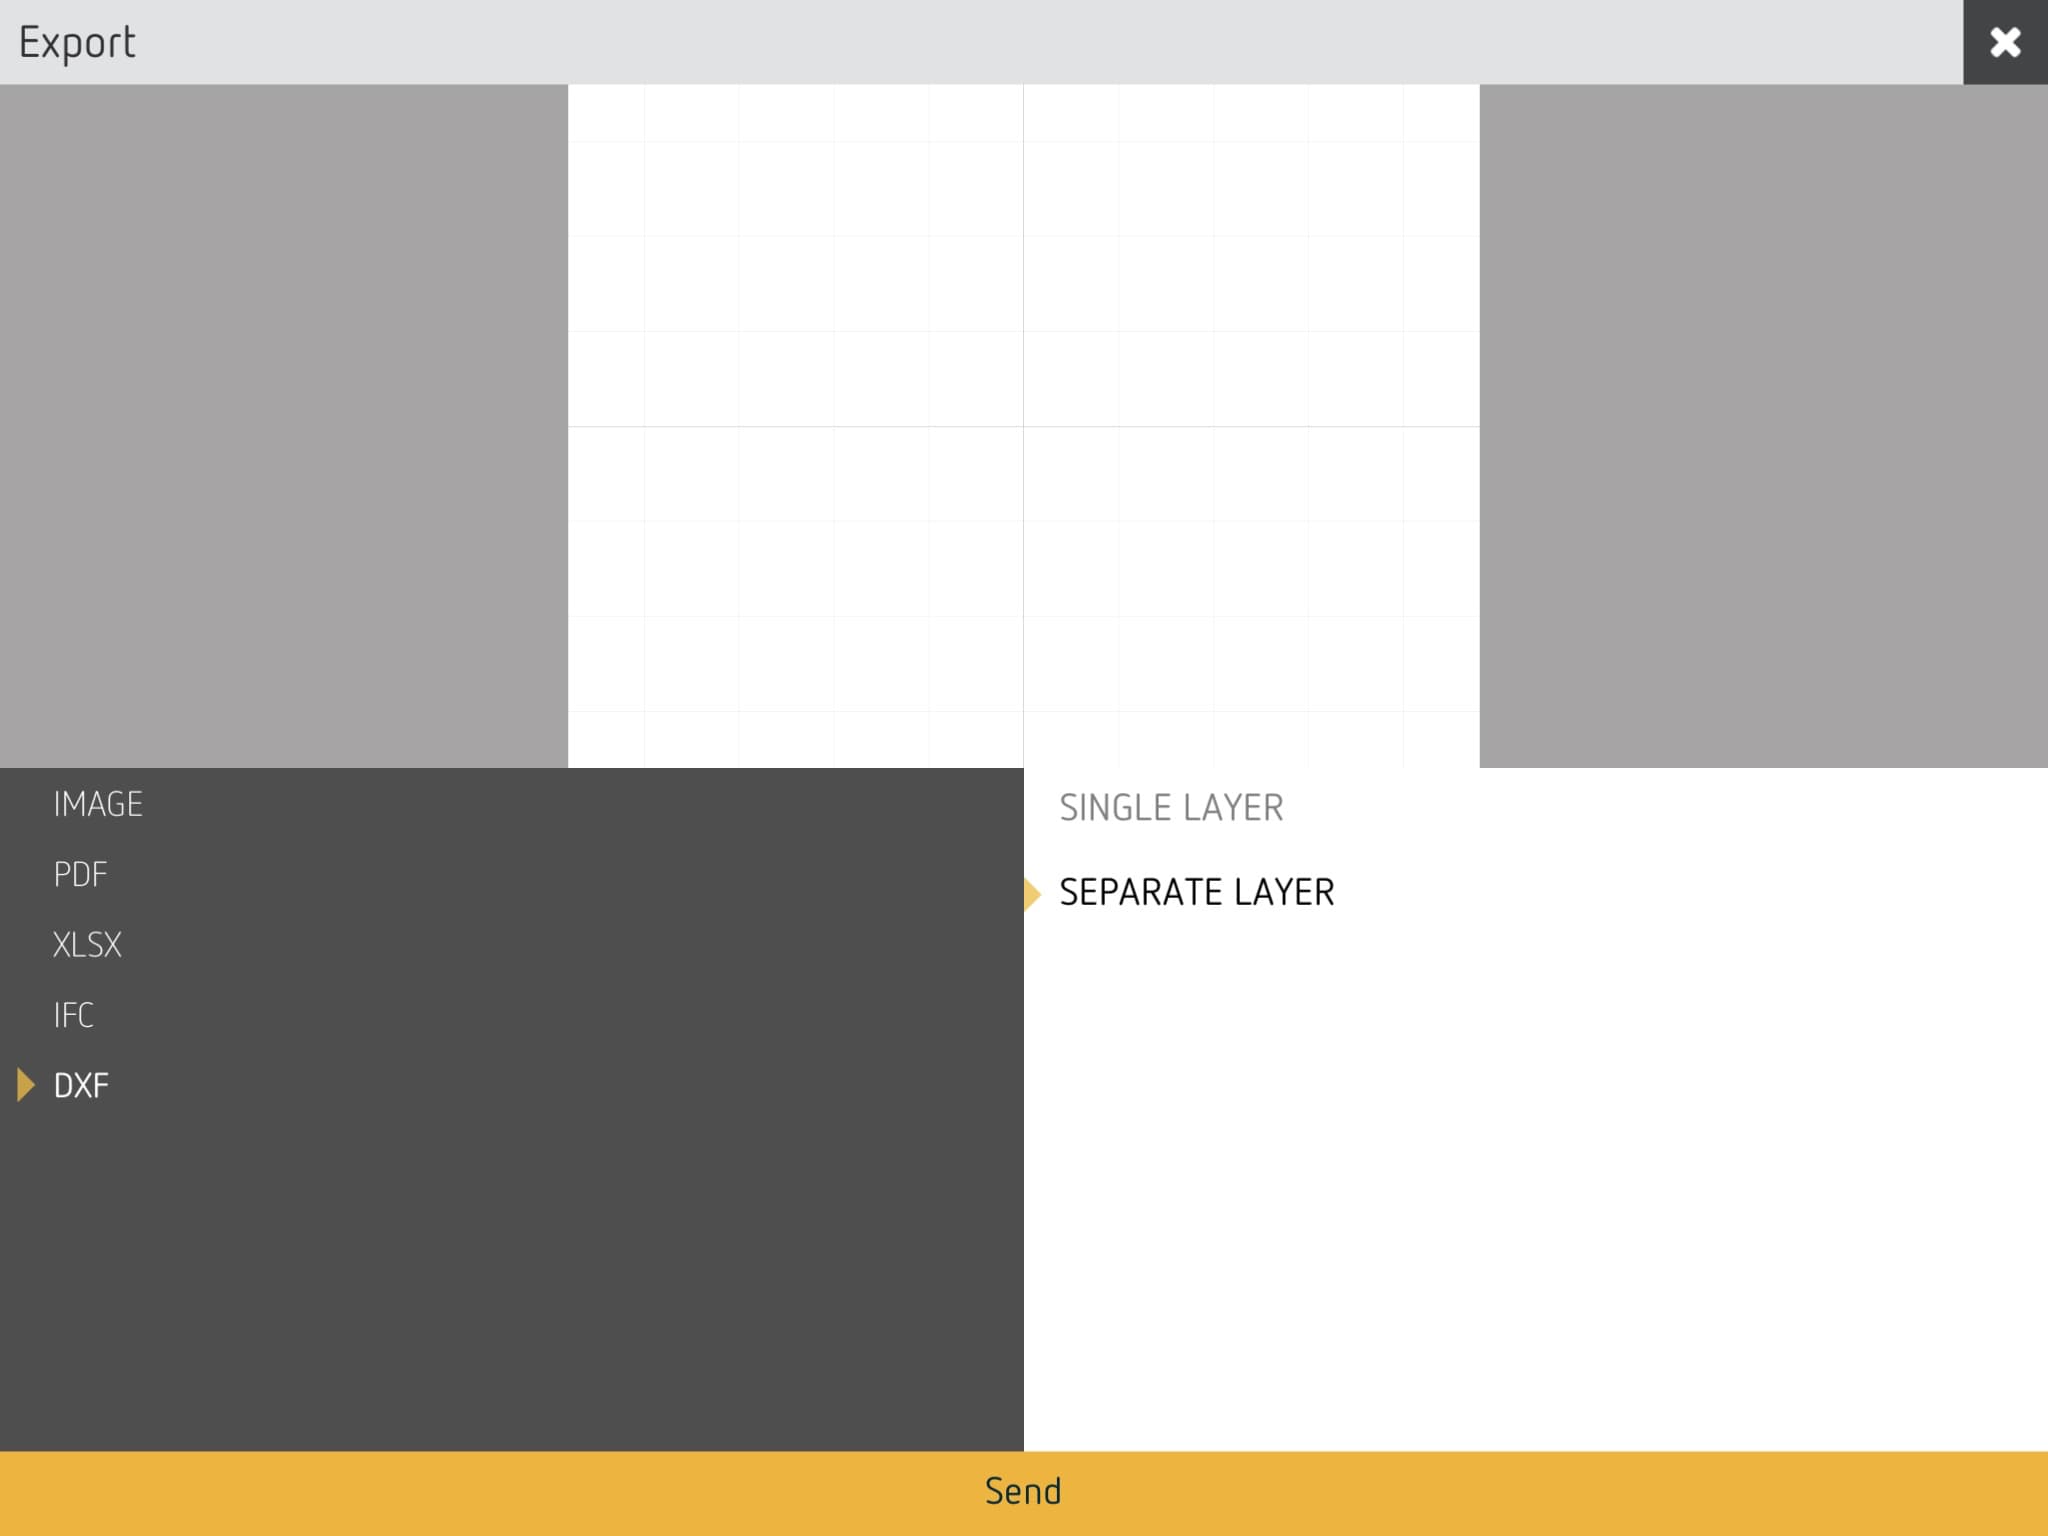
02 – The export options settings for DXF look like this.
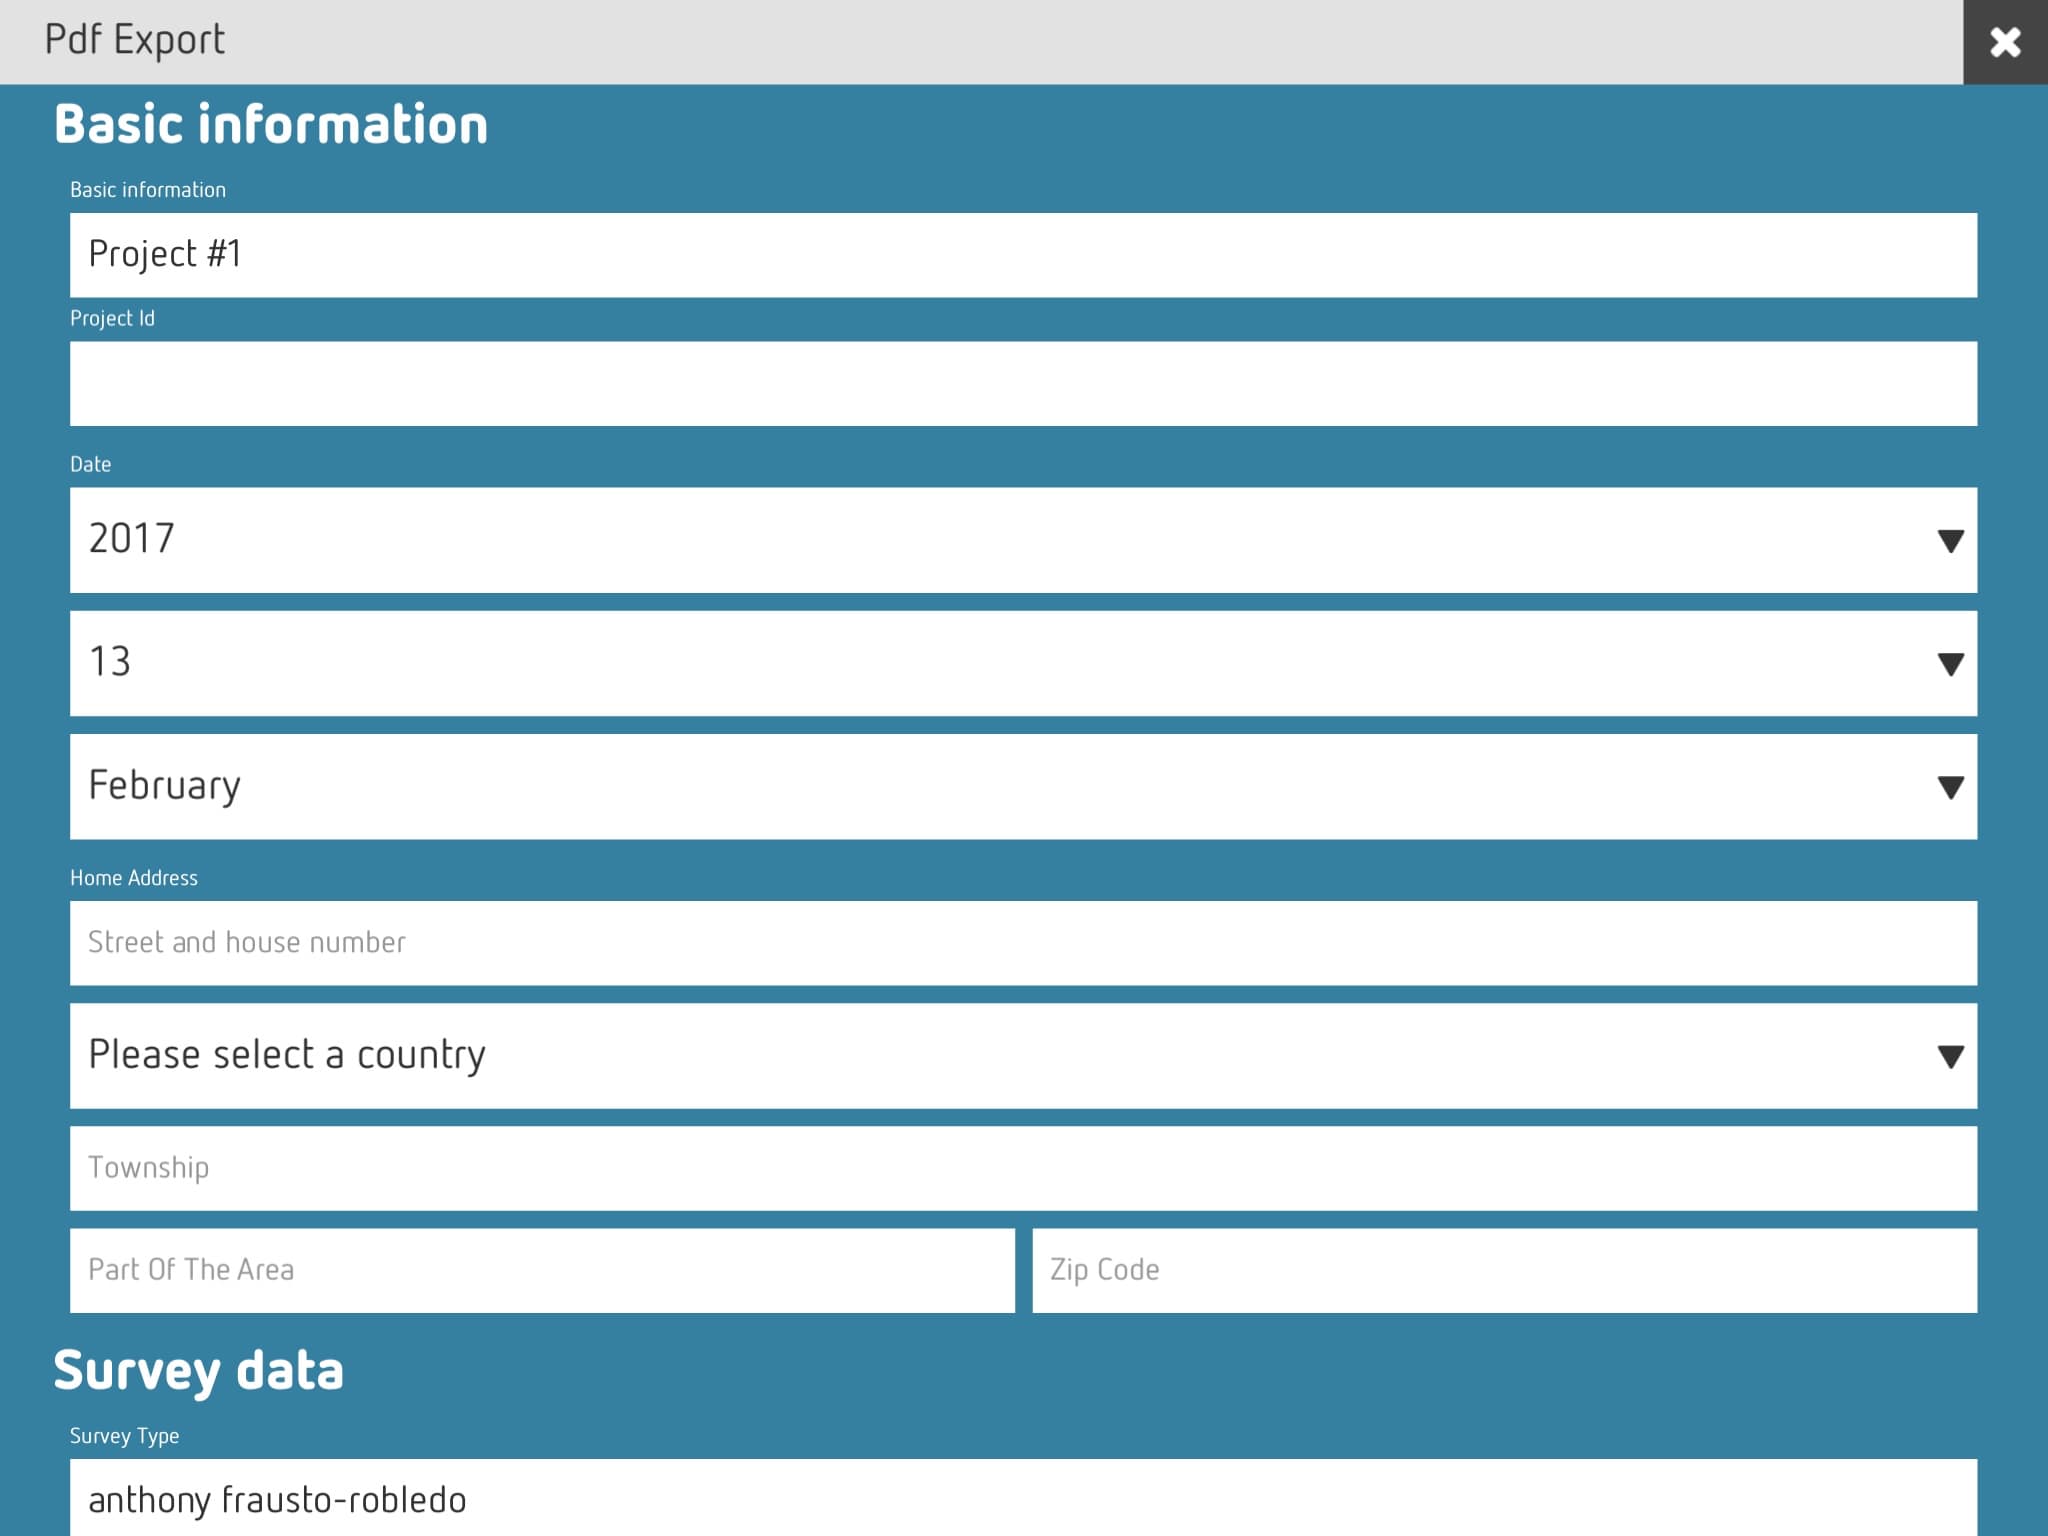
03 – And exporting PDF reports looks like this.
Back to the Main menu screen, one can see options for exporting your work and the app settings. Below this is listings of your actual measuring projects. And below that will be the area where your can set up OrthoGraph I to be Bluetooth connected to a LDM. (image 01)
Clicking on the “Export” setting will lead you to a screen that looks like the image above (image 02) and includes setting options for various file formats OrthoGraph I exports out to. For image files, for example, you can choose from small to medium to extra large setting options for export output. Choosing “DXF” gives you options for exporting with a single layer or separate layer mode. “IFC” export contains no settings. “Excel” file export also does not contain options. The PDF setting (see image 03) is for exporting an OrthoGraph I report and contains the project name, date, address, and survey data and basically sets up for a report export.
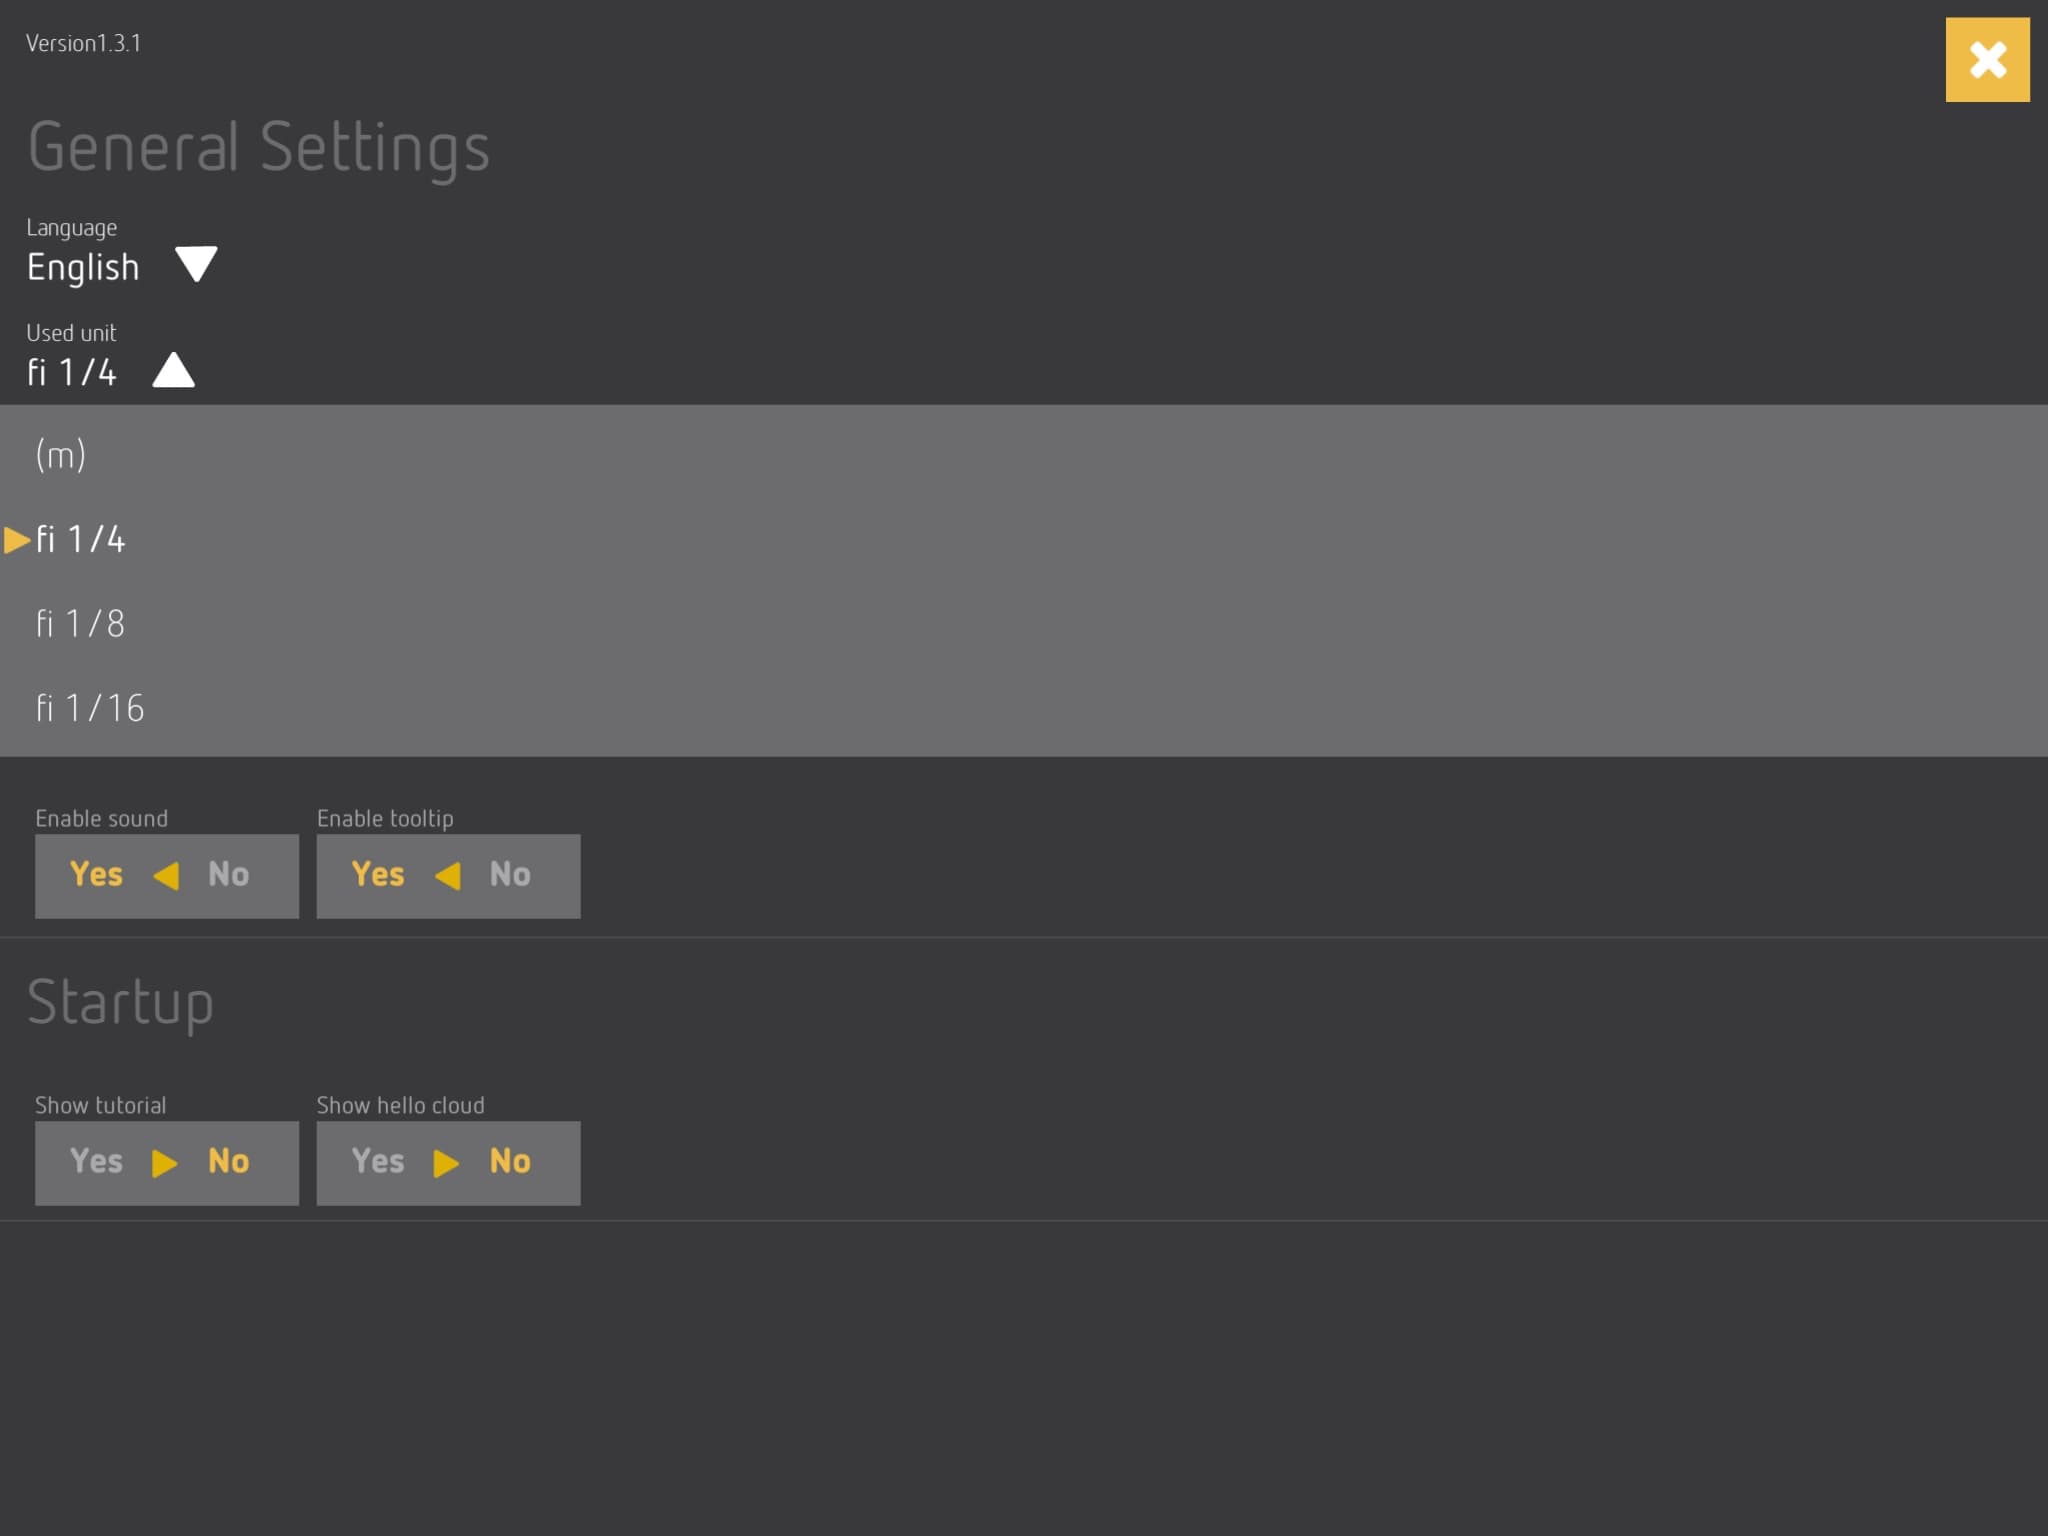
04 – Setting up “units” within OrthoGraph I.
The “Settings” button takes you to a new screen that allows the user to select a language for the program. Choices include English, Hungarian, German, French, Japanese, Italian, and Spanish. The next setting option is important for most users and it is the “Used units” selection. A scroll selector offers various units and options within those units. Feet and inches down to 1/4 of an inch (1/4”) was selected for my review work. (see image 04)
Measuring Your First Room
Now that my D2 is correctly synced and connected with the app, I start by drawing my first room. I will add that it took me some time to get really good at drawing rooms with some complexity in them. One should put the focus not on the attempted accuracy in length of each side of a room but rather on the core shape, each turn or step in a room and closing the room by getting the last point in a smart position so it “closes” the room.
05 – The main screen and main Toolbar looks like this. OrthoGraph I smartly has a fan wheel type pop-up tool bar in the far right corner. It’s rather brilliant.
Yes, a common mistake first-time users make is not closing rooms when attempting complex shaped rooms. This happened often when I first started working with the app a few months ago but over time (and perhaps with even some app updates) the closing complex rooms process improved dramatically. I am sure it was probably just me learning the art of this part of the program.
So what happens when a room doesn’t close? Well…you end up with a gap, two vertices (control points) are present rather very close to each other but they are supposed to be the same point. (see image 07) When this happens, I just start over. A successful, closed room looks like the image above. (see image 06)
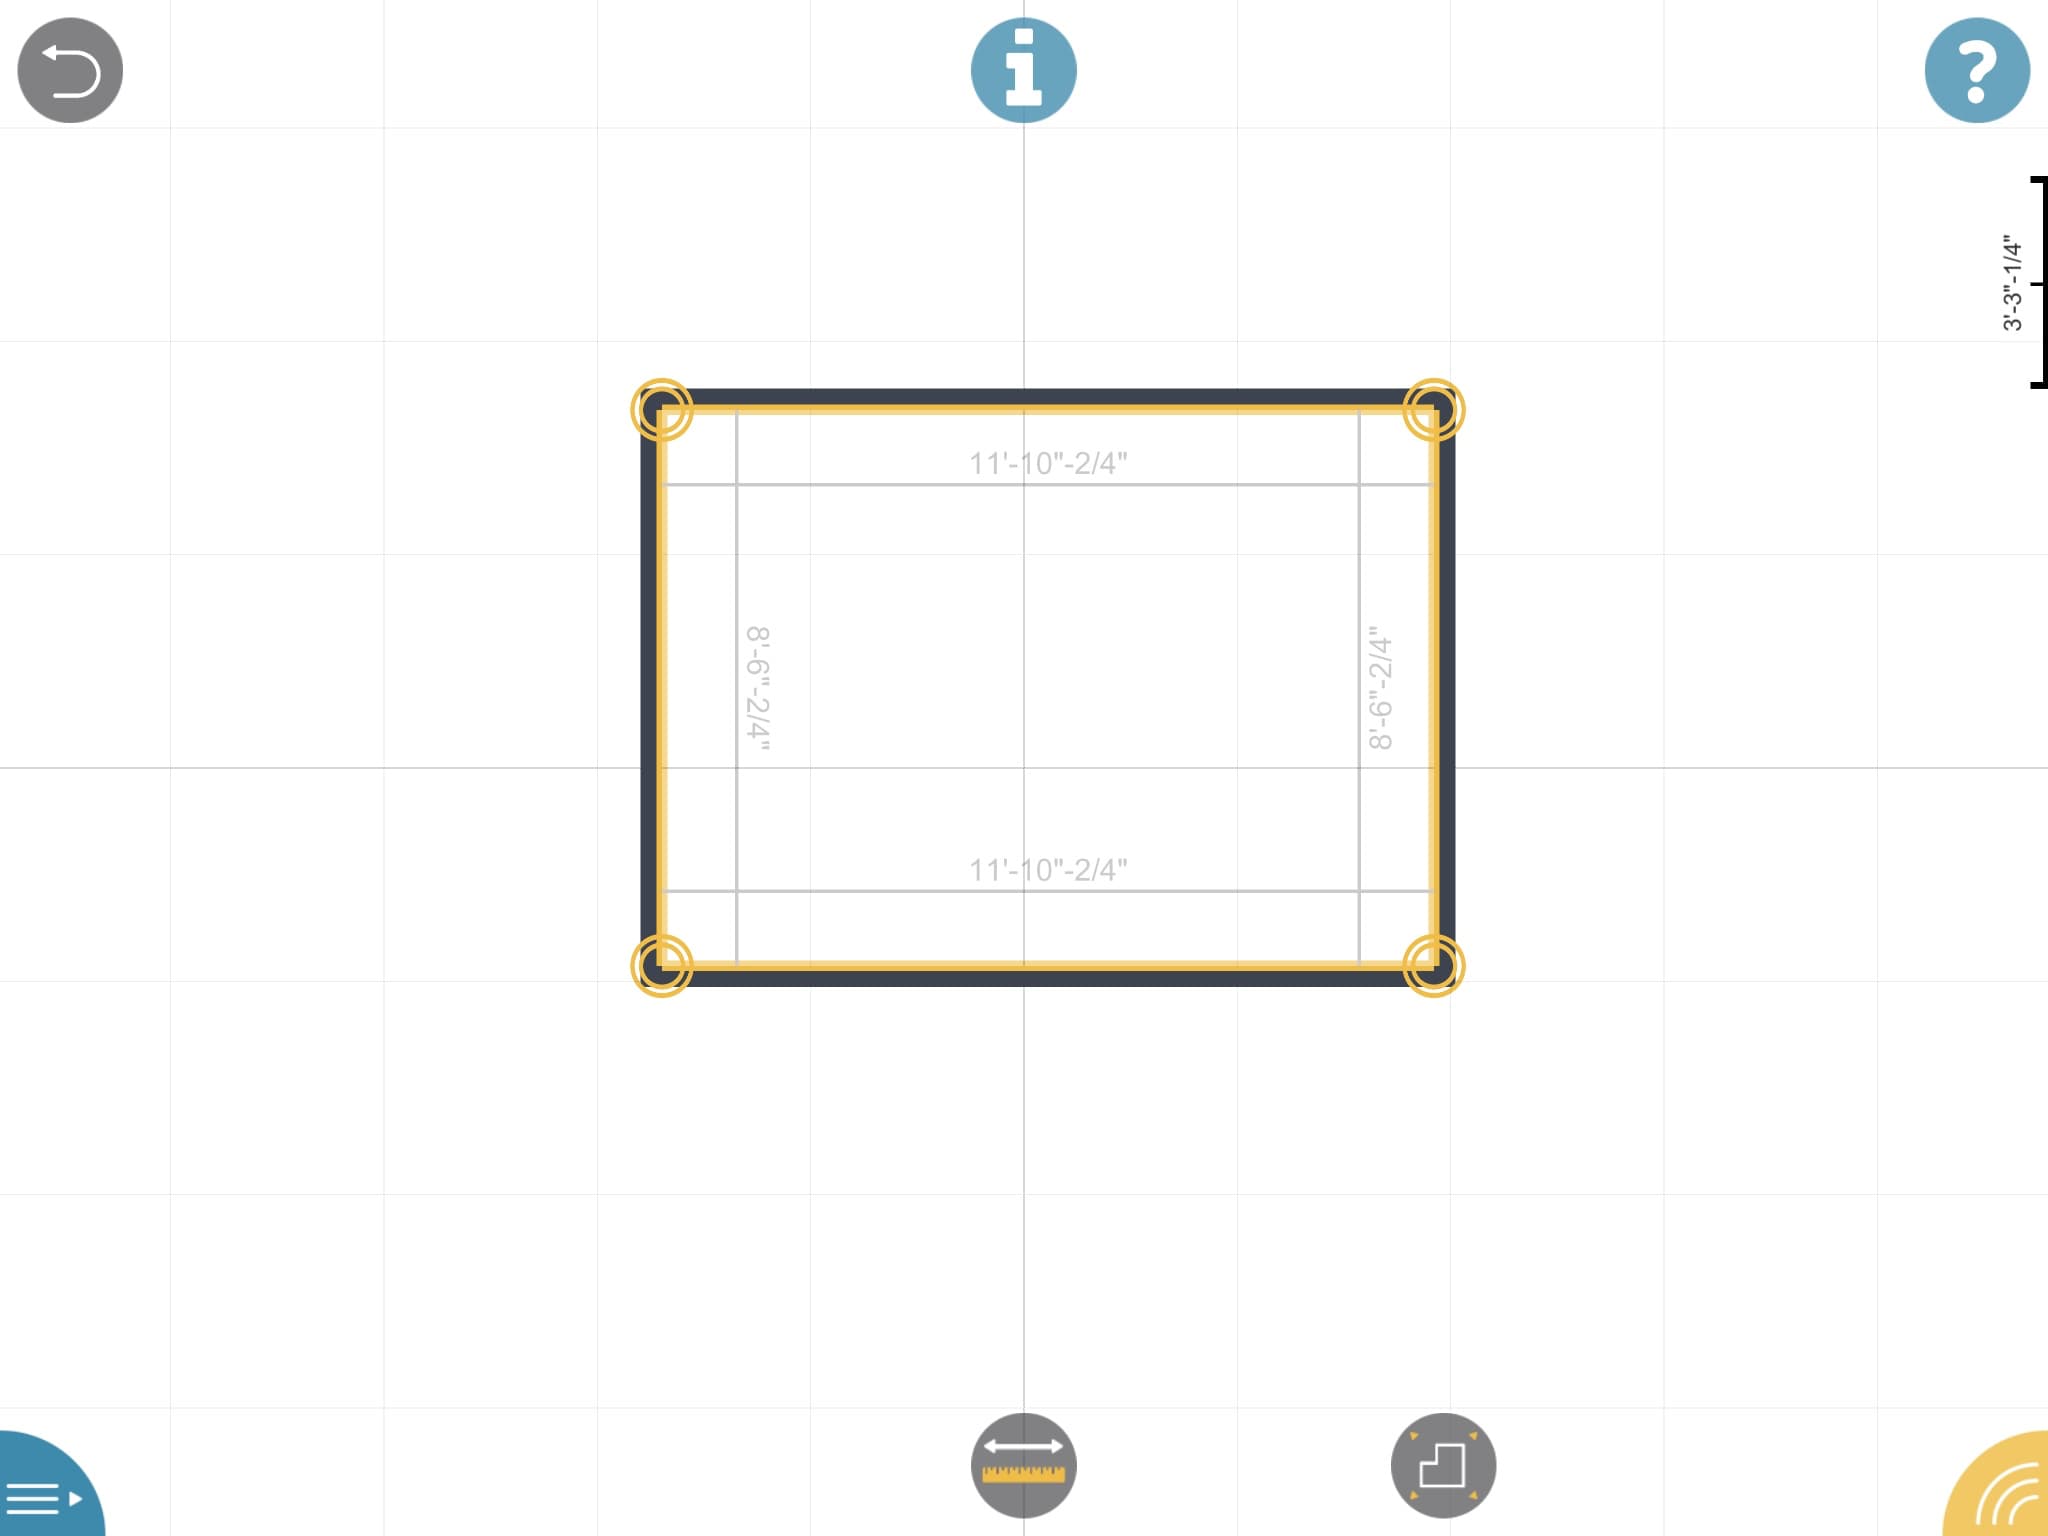
06 – A successfully closed room looks like this, corner points (vertices) highlighted in “yellow” circle icons for multi-touch engagement.
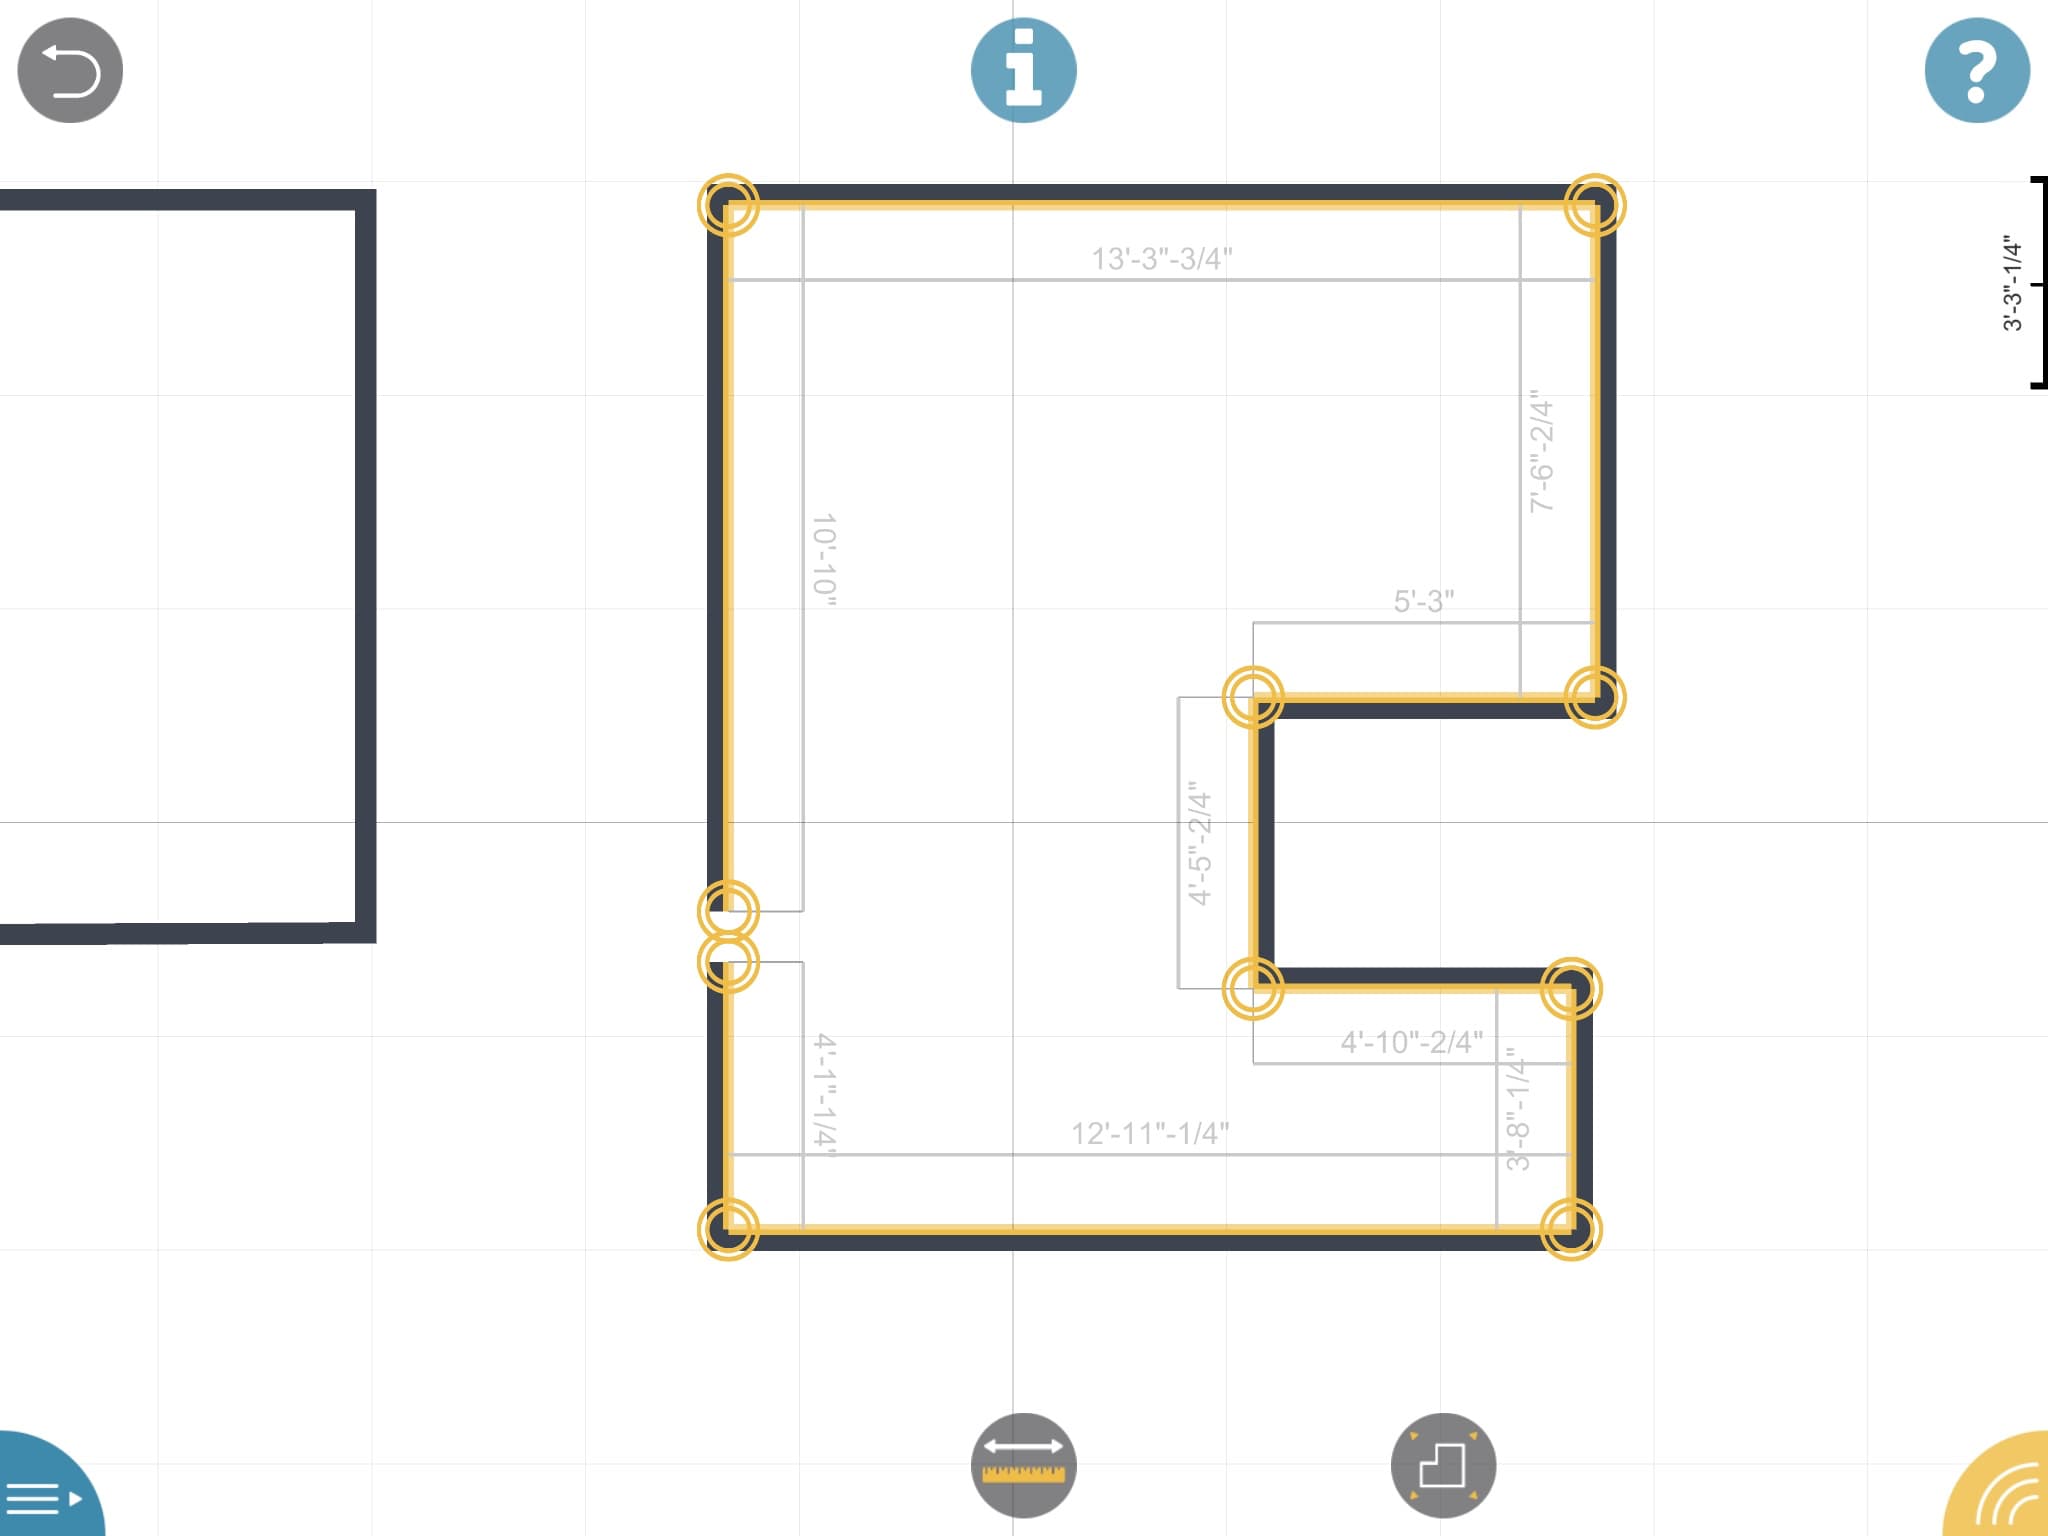
07 – Sometimes and sadly this happens. You fail to close a complicated shape.
It’s important to note that the room must be “highlighted” before you attempt to measure it. This being the case when you have drawn several rooms in a row. By highlighted I mean yellow vertices controls appear on the corner points.
Drawing a room starts by accessing the Toolbar “fan wheel” (image 05) that displays three levels of tools. These tools are displayed first by if they are 2D tools or 3D tools. The pencil icon is the core tool for the creation of rooms. Once selected, a “help-tip” slider window appears on the lower left side of the screen and then quietly disappears. In the case of the pencil tool it says “Draw the approximate shape of the room you are surveying.”
The actual process of doing this is simply to sketch with your finger the basic shape of the room. If you are using a stylus like the Apple Pencil, just use that. In OrthoGraph I, your freehand lines will magically harden to straight CAD-like lines with a wall-thickness. They will also display yellow concentric circle icons denoting control points (vertices) delimiting the start and end points of objects (eg: walls, doors, etc). (see images 07 and 09) I will touch on these circle icons in a moment.
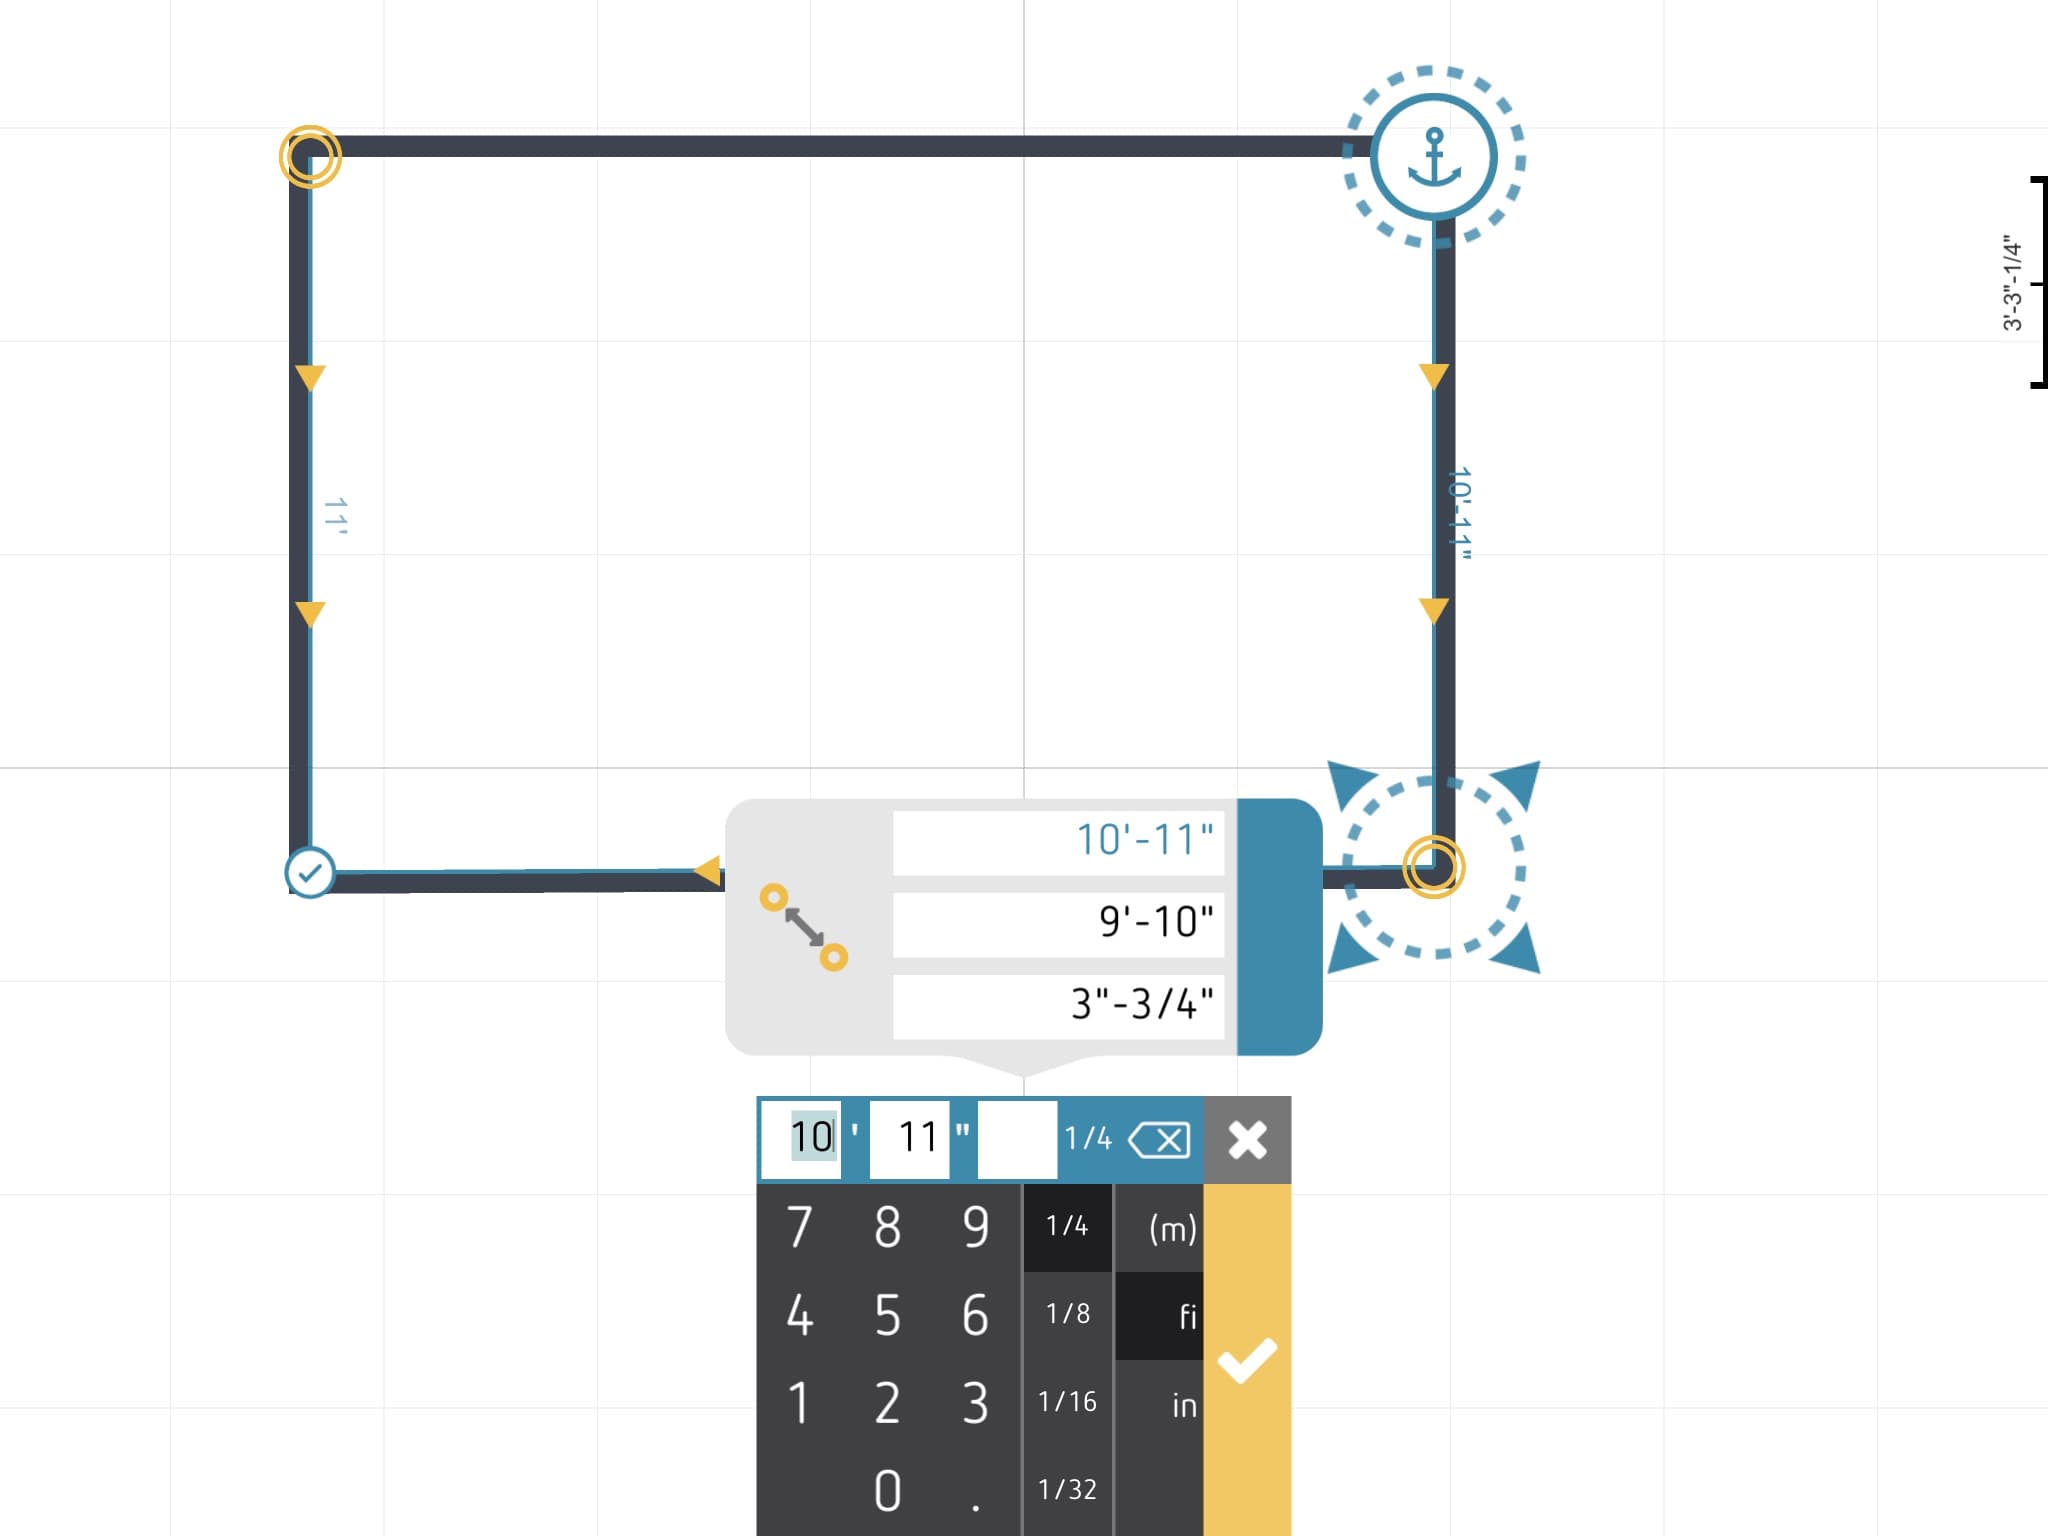
08 – Measuring is a process whereby you trace with your finger the length of a wall by engaging its two control points. This invokes the numeric keypad for entering the actual dimension you have measured in the field.
The next step in measuring your room after you have sketched it out in OrthoGraph I is to input measurements. If you use a tape measure the procedure is as follows: Select the icon with a measuring ruler and two arrow-headed line above it (always on the center lower section of the screen). Next, touch a yellow circle (vertice) and keeping your finger down push it to the opposite end of the wall and into the terminating yellow circle icon (vertice). When you complete that step new icons will appear around each control point. They will be animated and in the program’s default blue color. (see image 08) The “anchor” icon means that point is fixed within the overall points making up the room. The “non-anchor” point will adjust once you input a value but it is not fixed and may move its position based on further survey data.
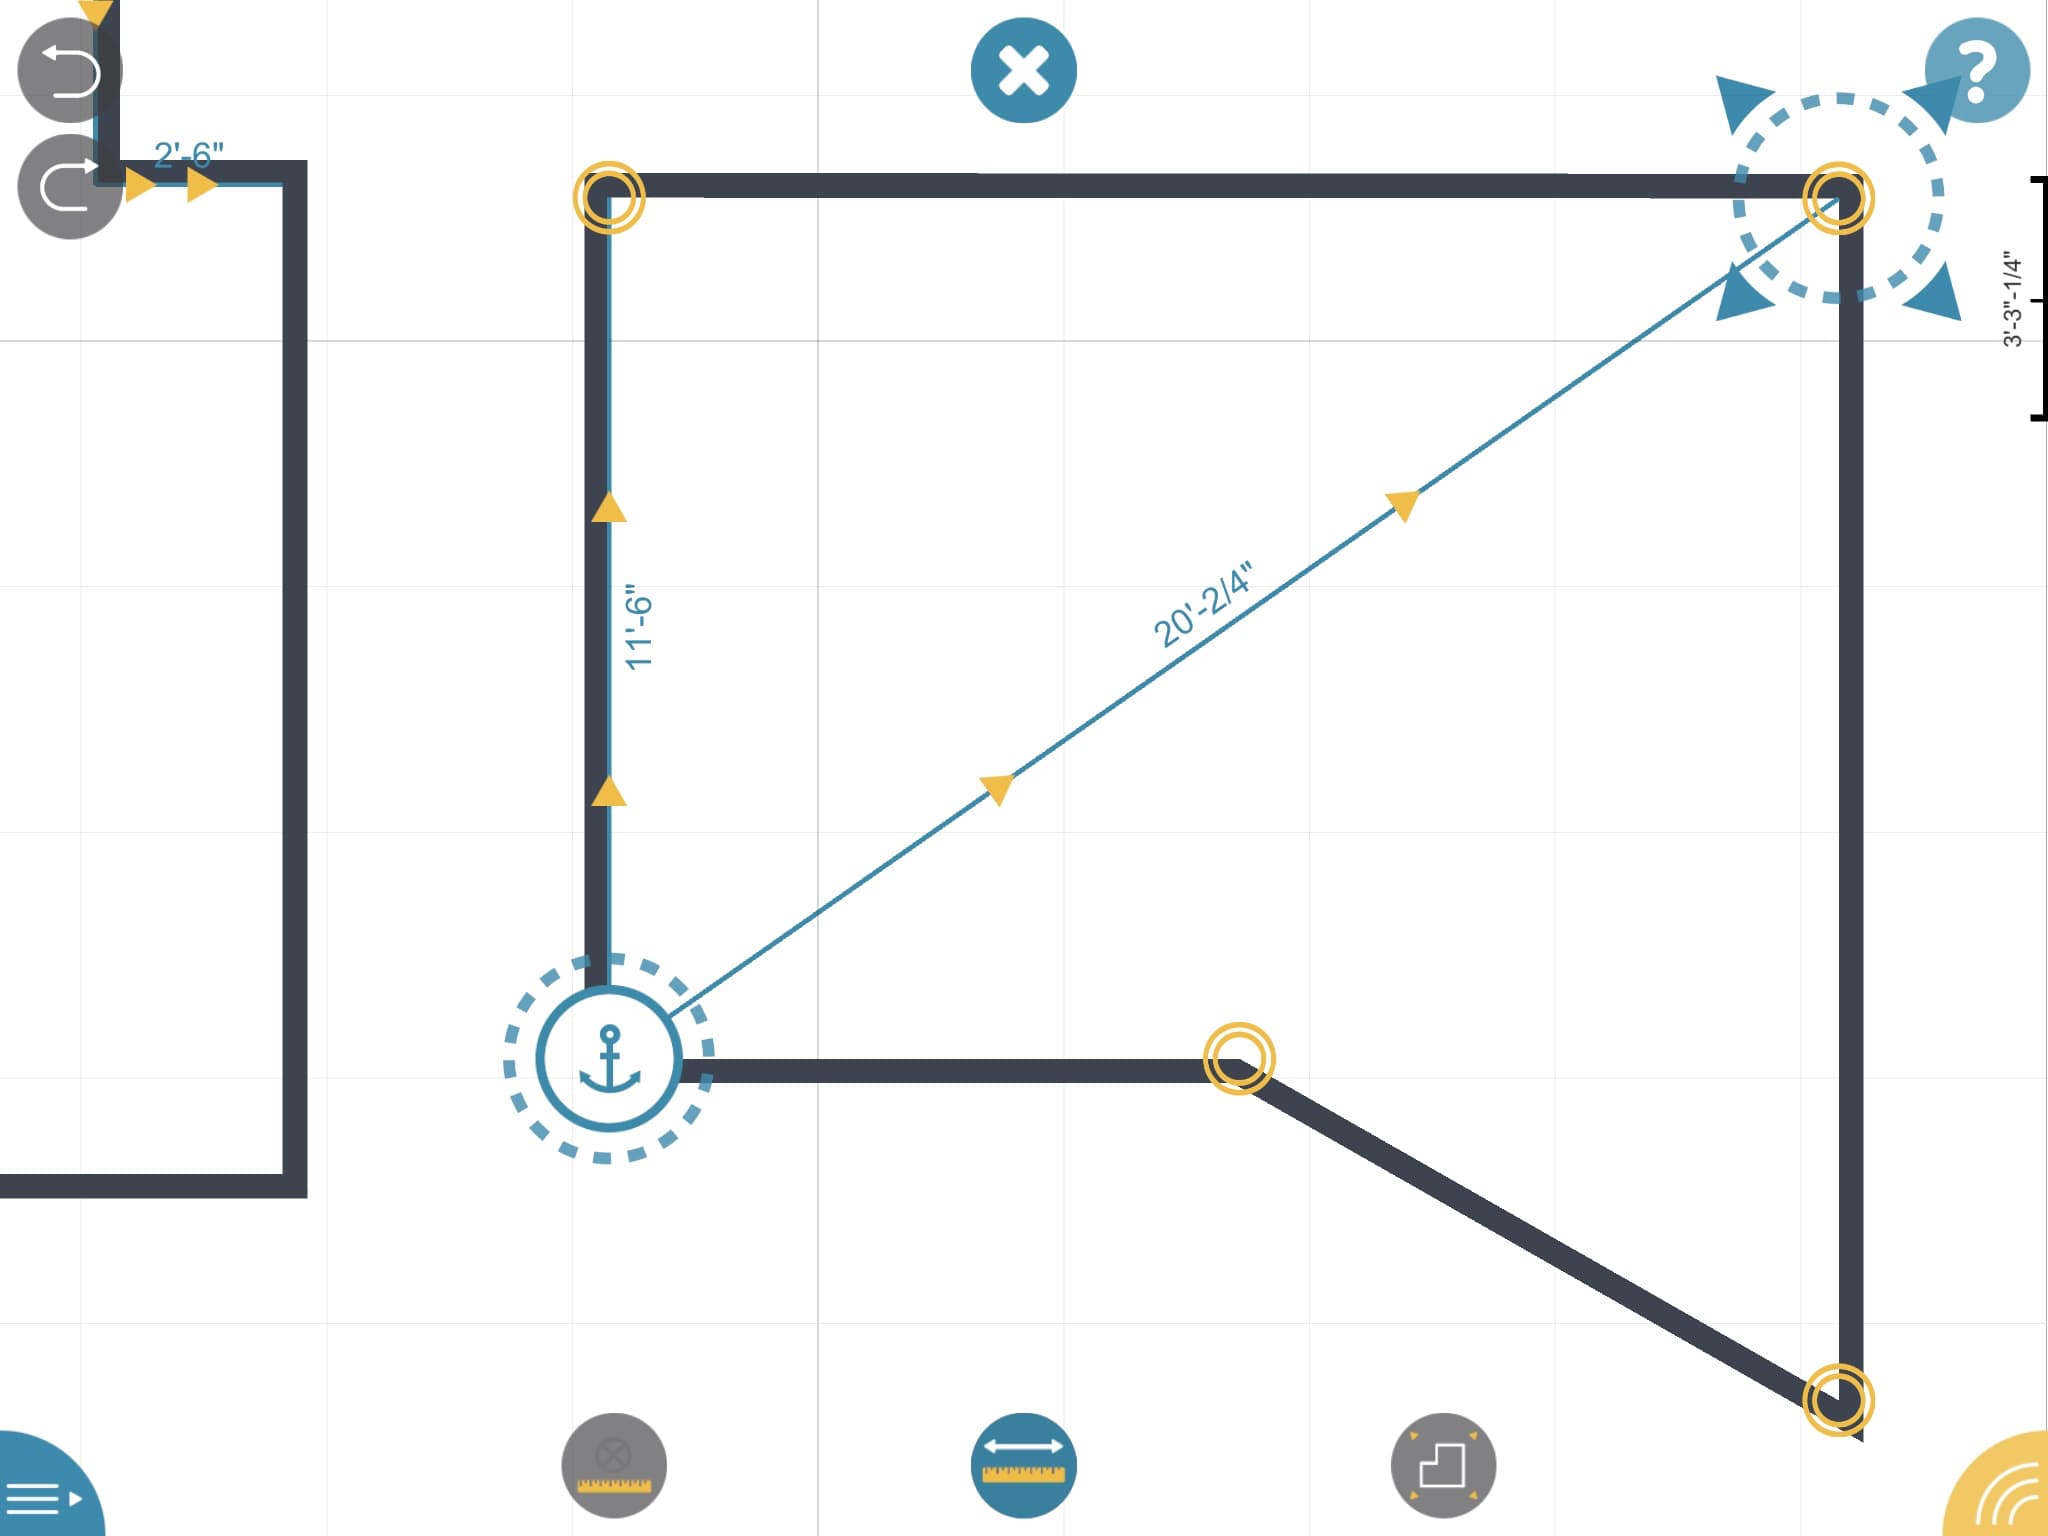
09 – Diagonal measurement is very useful for confirming accuracy in the measuring process.

10 – A confirmation “check” appears in a circle at a control point meaning it is confirmed.
The numerical keypad is presented below the wall—awaiting the user’s input. Type in the correct measurement value and hit the “check” button (in yellow). (see image 08) That confirms the value. The plan will automatically adjust and other points and walls may adjust with it maintaining their 90-degree corners. It is possible to measure across a room from corner to corner, which helps confirm angles. (see image 09) Arrows in yellow indicate the direction taken from the anchor point to the second point. When two dimensions to the same point are input into OrthoGraph a check box appears in a circle, confirming its position. (see image 10)
next page: Attaching Rooms and Doors
Attaching Rooms and Doors
One of the less intuitive features of OrthoGraph—and yet ironically one of its most important—is the tool that merges or attaches rooms to each other. When you select the Move tool the helper window yields the following text: “Move location. Move, attach and detach rooms to other rooms.”
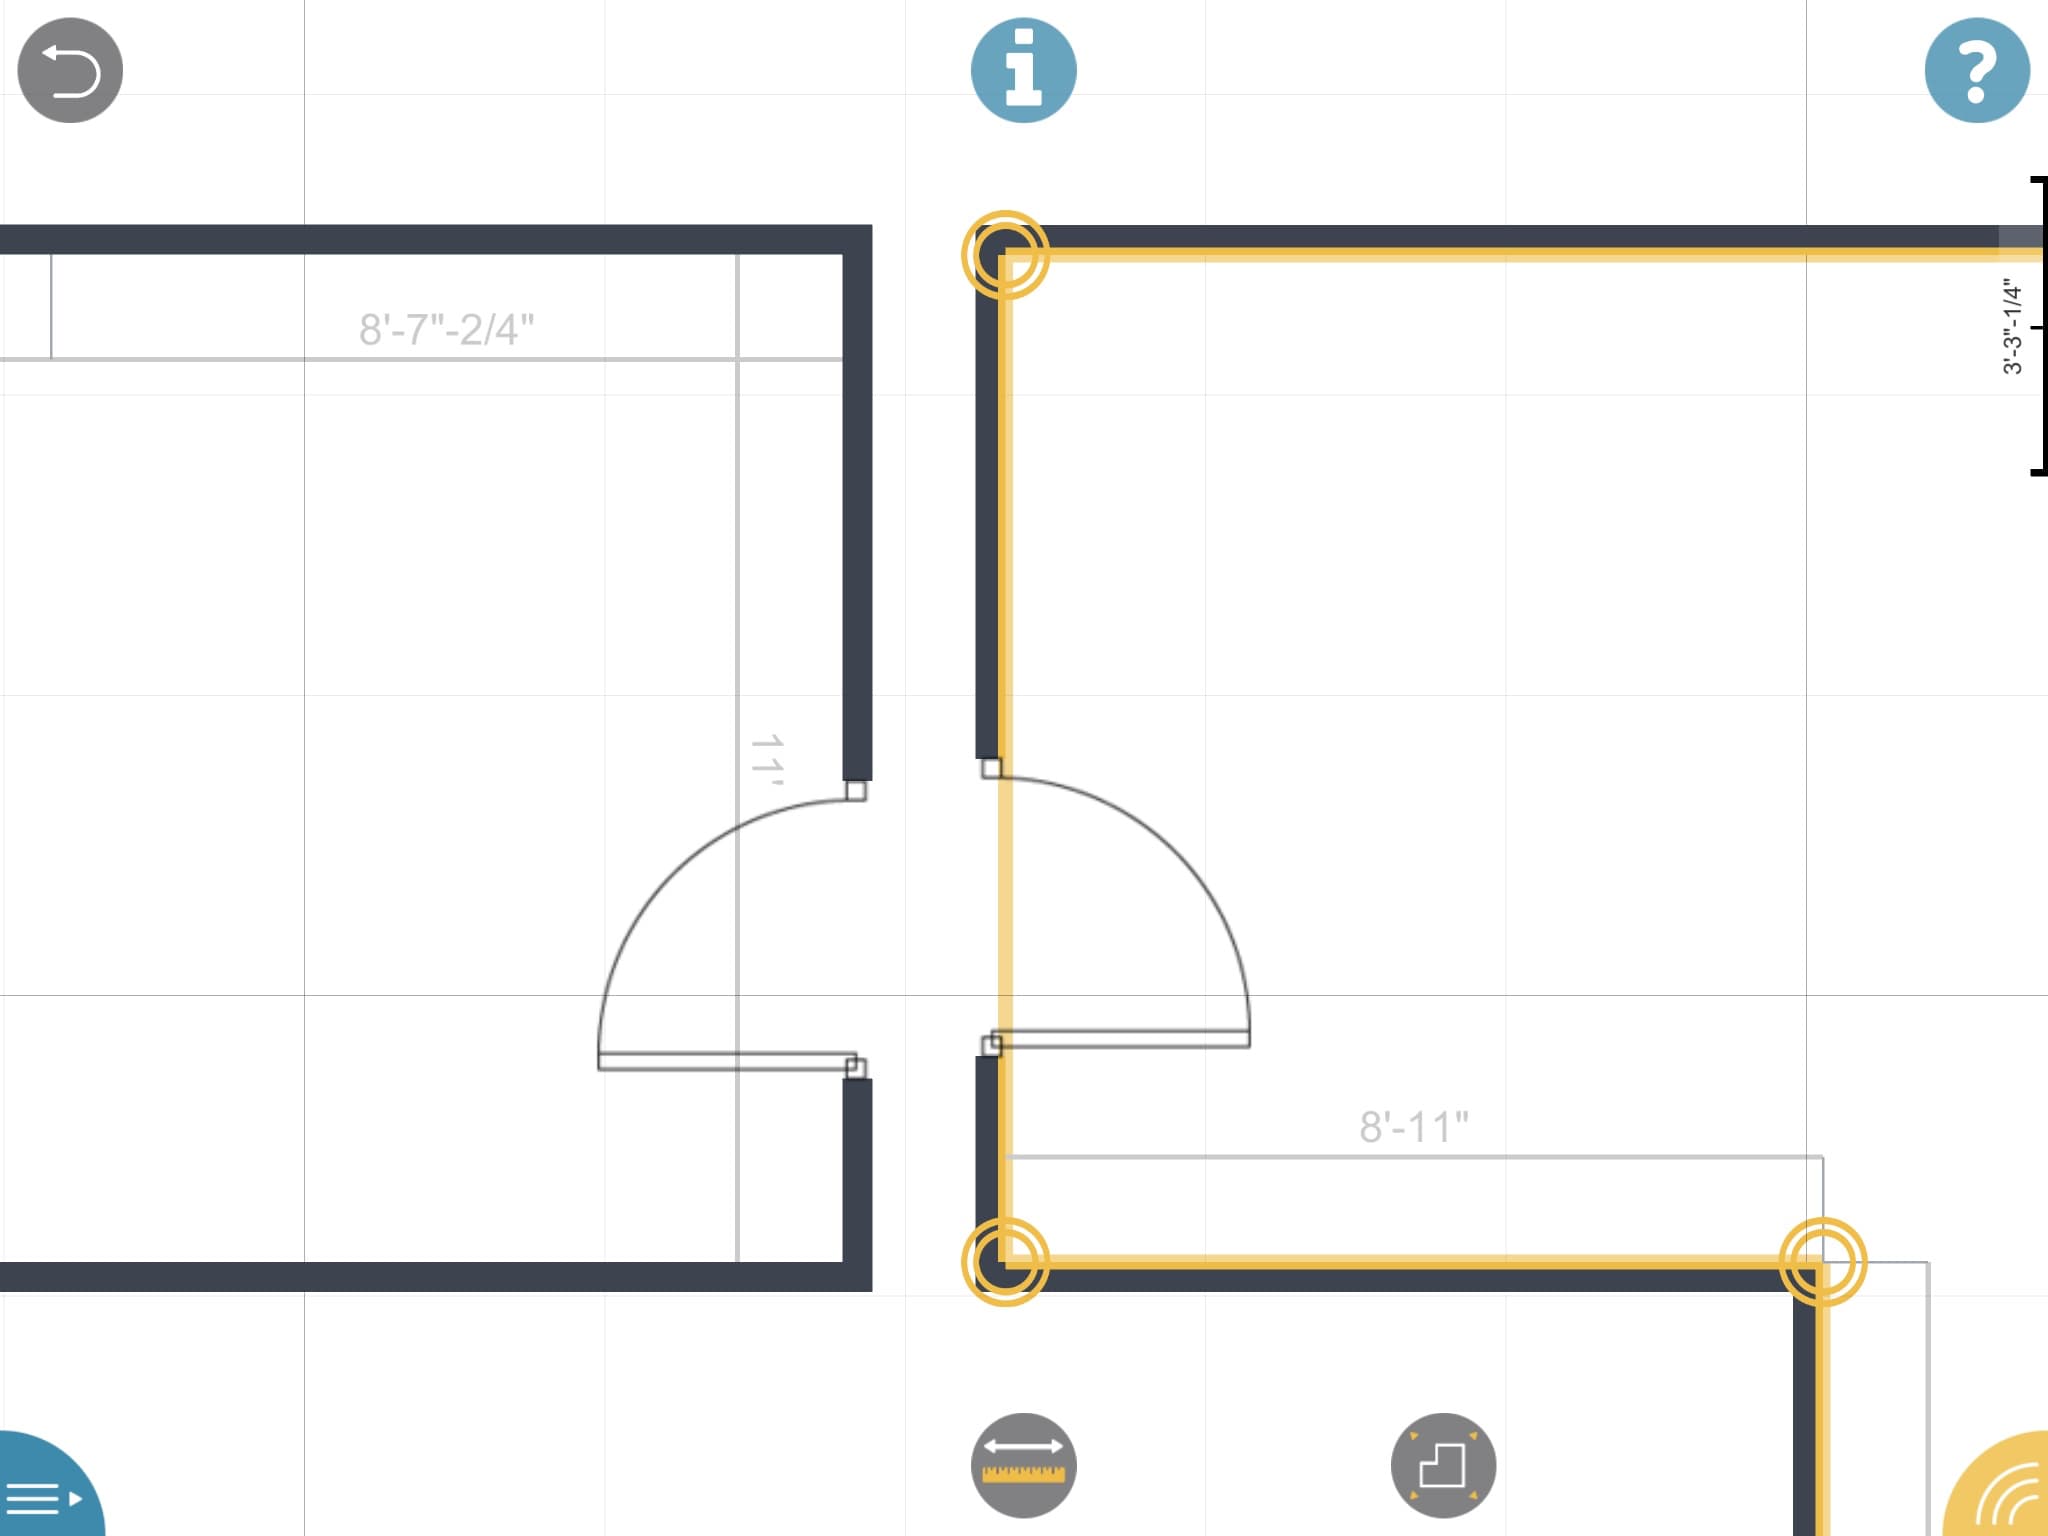
11 – Attaching or merging rooms to each other is how you conform your separate measuring survey exercises into comprehensive building survey layouts. The two doors above are actually the same door in the same wall, which needs to get merged.
While this seems simple enough there are some hidden rules to make this feature actually work simply. If the rules are not met it won’t work simply. In the image above (see image 11) I have purposely located a door in each respective room which actually share a wall. However, the doors—which are actually the same door since they are in the “shared” wall—are located in slightly different positions relative to the nearest corner. When I go to move the room to join with the other room it will fail unless I move it such a way that the door in the room I’m moving (in the process) overlaps the door in the other room. Being that these doors are actually the same they must interlock in this procedure. The walls will join but the corners of the room are now slightly askew. (see image 12)
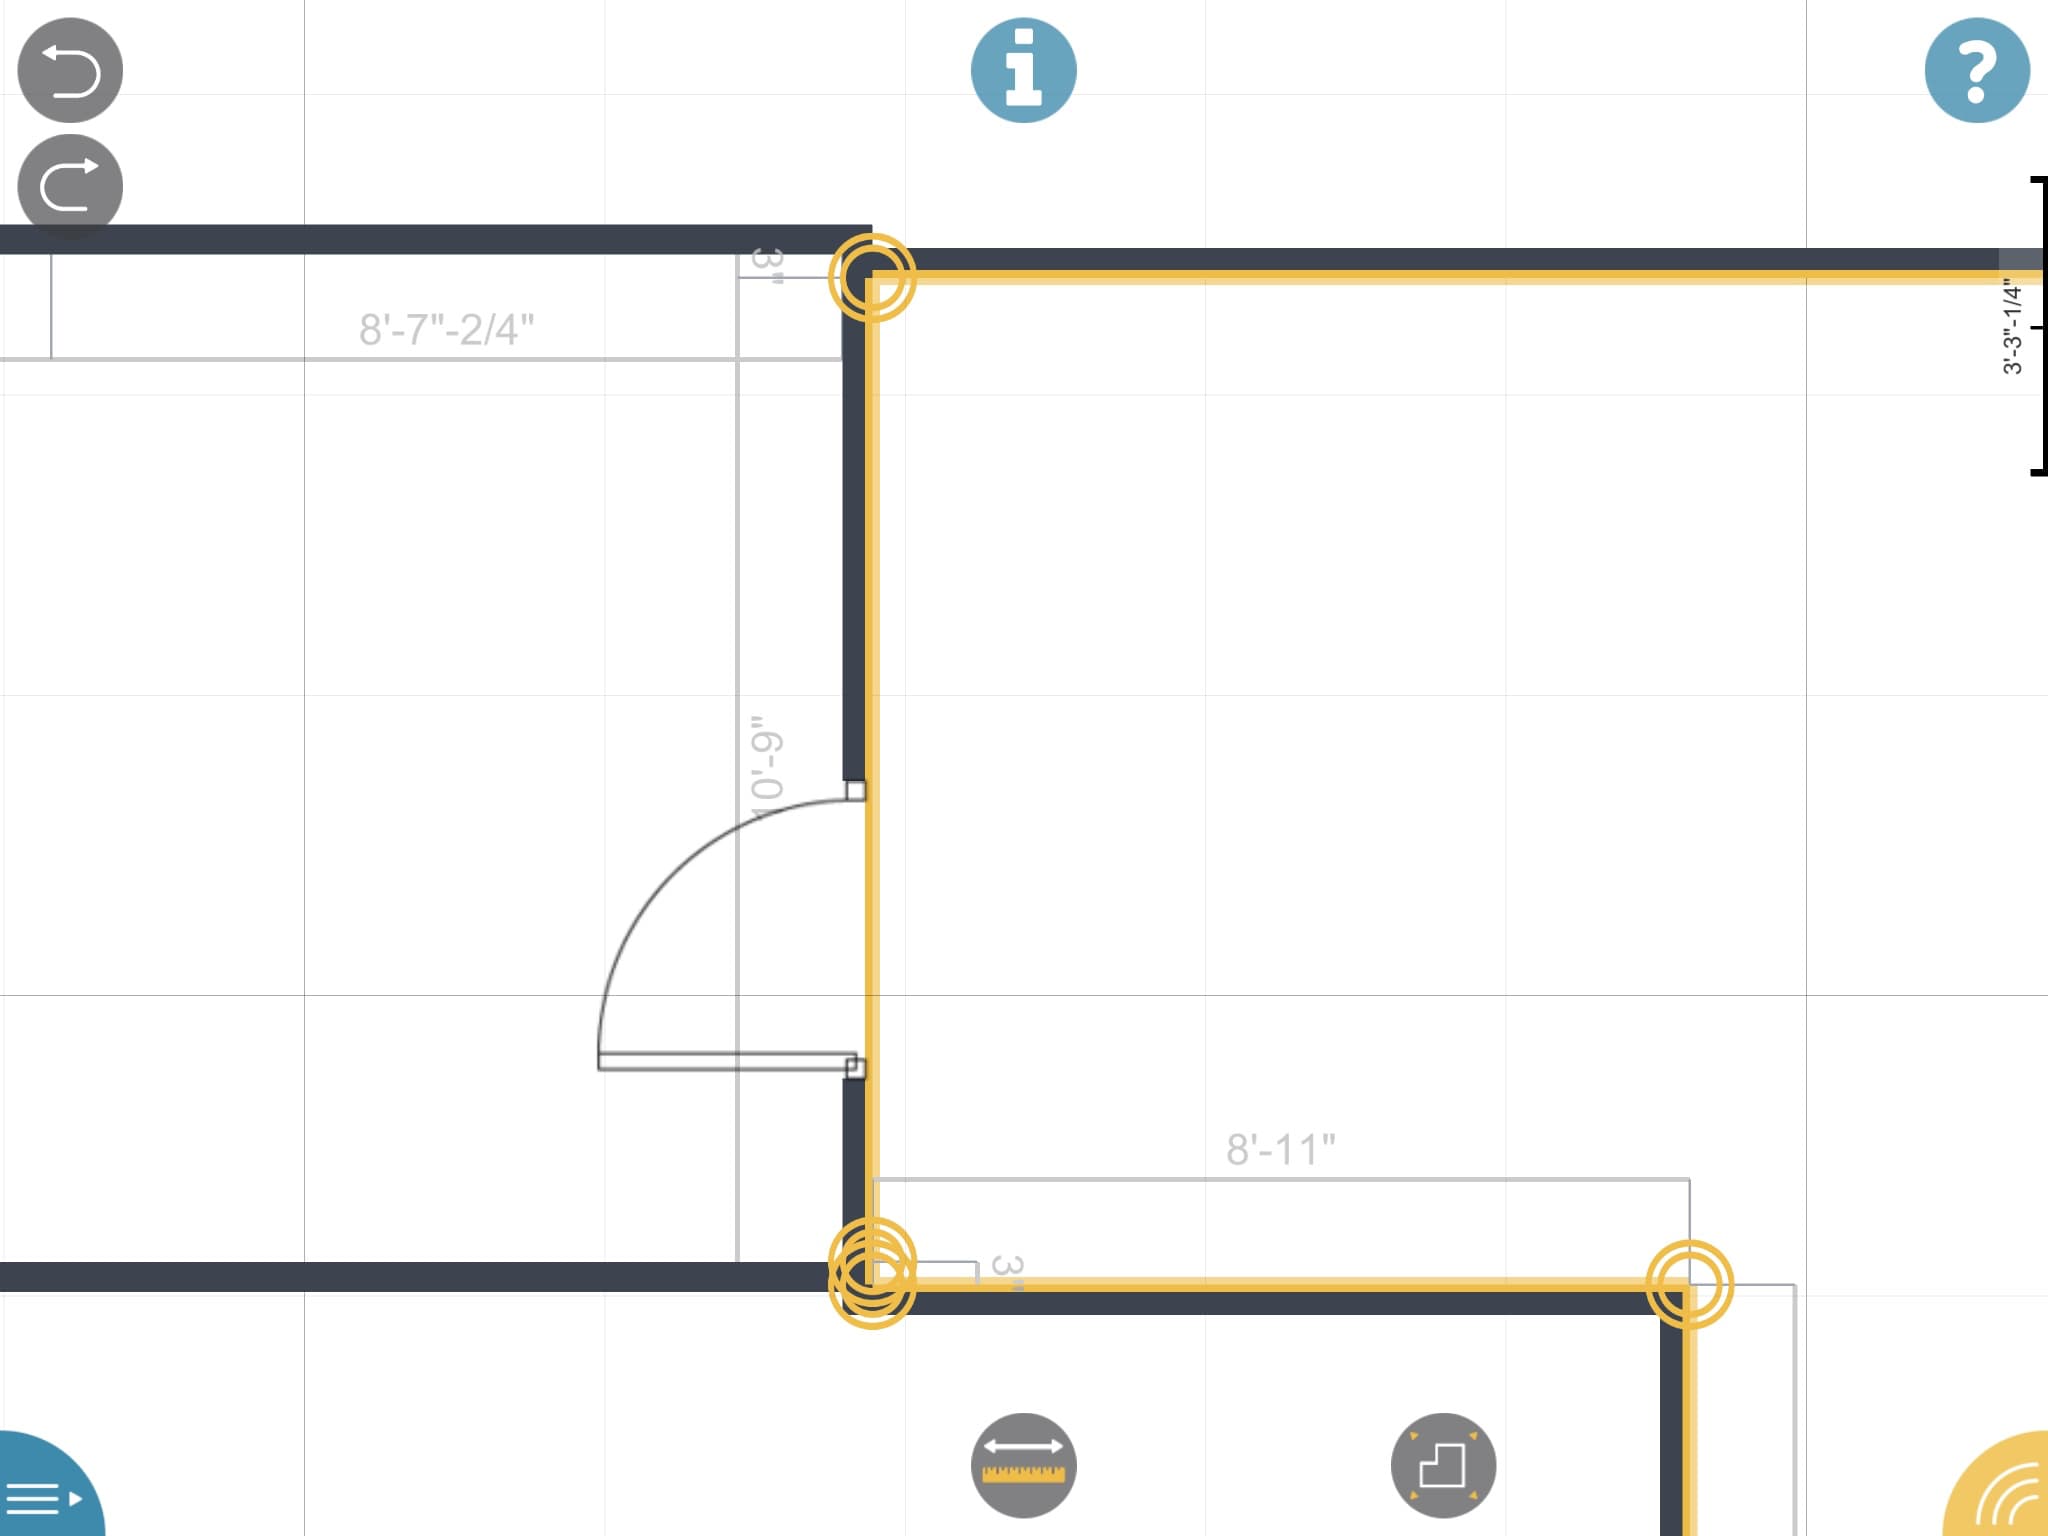
12 – I have joined the rooms by aligning the common door. However, different dimensions to the door from the corner forced this error of sorts. Is it an error? Or is the wall actually not aligned? Your actual survey experience will dictate the answer. Perhaps a room is “padded out on one side of the door only?
The truth is this may actually be accurate. If wall thicknesses vary from one room to the next, the actual dimensions from corner to door from each respective room may indeed very. This is, in fact, how one discovers variances in an existing building that may seem counter-intuitive because in fact the building was built with oddities. A common oddity is the room on the left may have a wall (south in the image) that is “padded” out and thus thicker. (we will get to wall thickness in a moment).
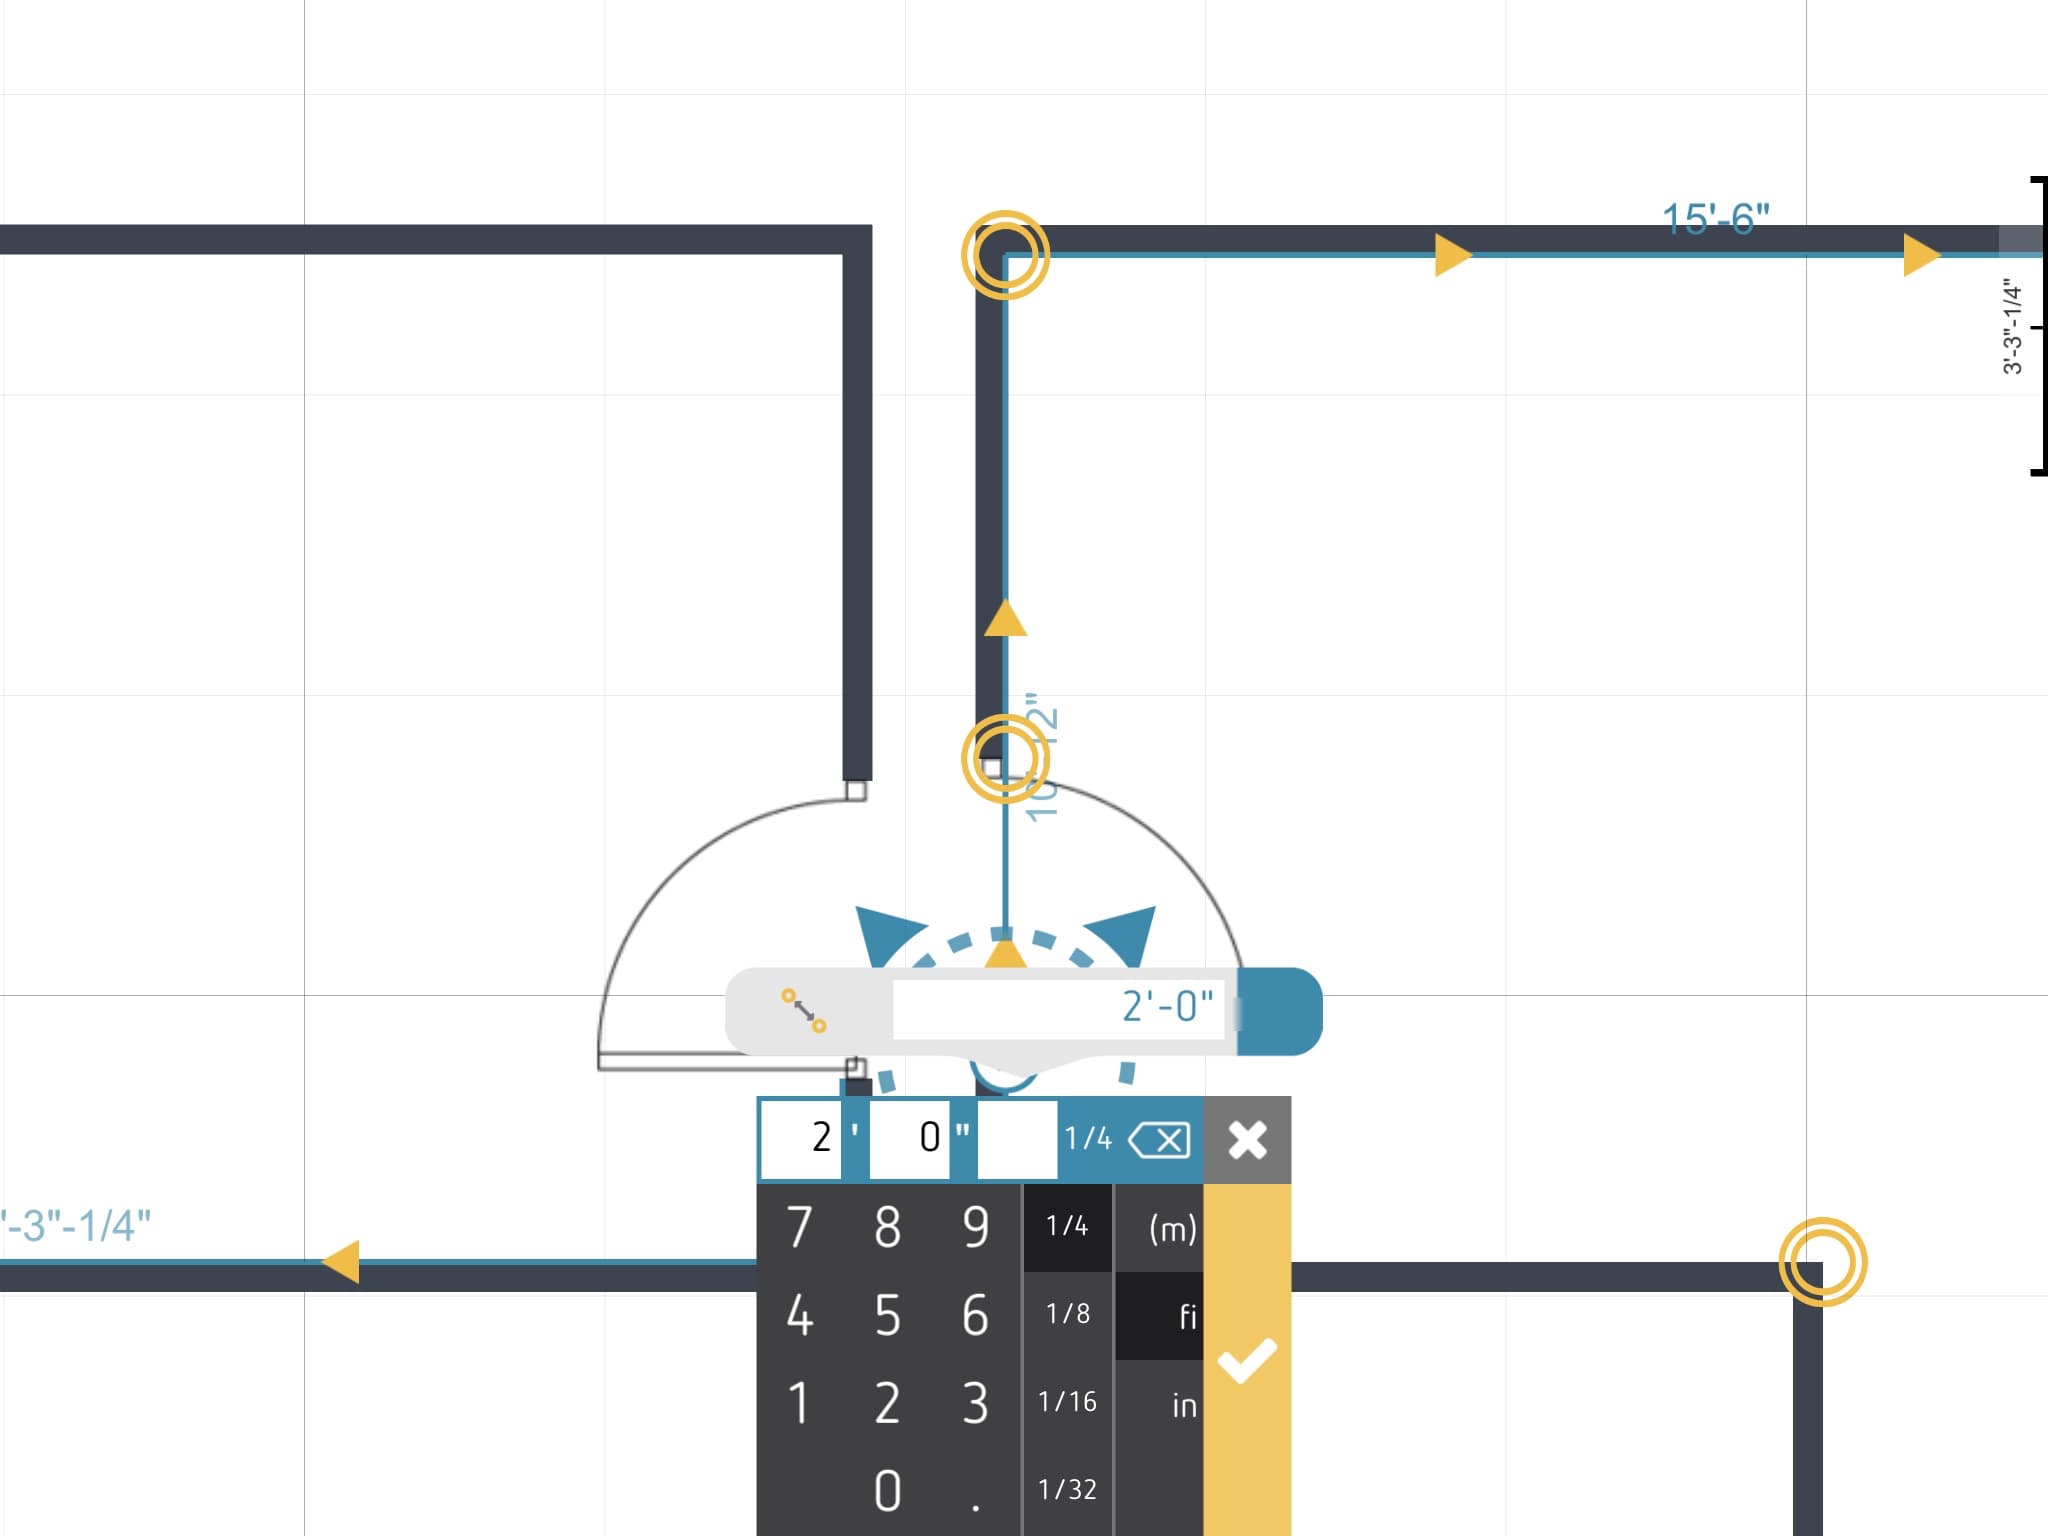
13 – If differences do exist but you know from the field the walls must align at least structurally, place a common dimension for the door from the corner (2 feet in my case). Then factor a pad-out by adjust wall thickness later.
Re-entering the dimension back to 2 feet to match the other room’s position for the location of the door will allow me to re-join the room the way I believe it must be in actuality. (see image 13) You may notice from the images above that the common door had a competing door swing direction—which direction does the door take? OrthoGraph will choose one and it may be the incorrect one. To fix it you must edit the door object itself.

14 – The door object settings popup dialog is clever and easy to work.
15 – The door is now flipped to the other (correct) side.
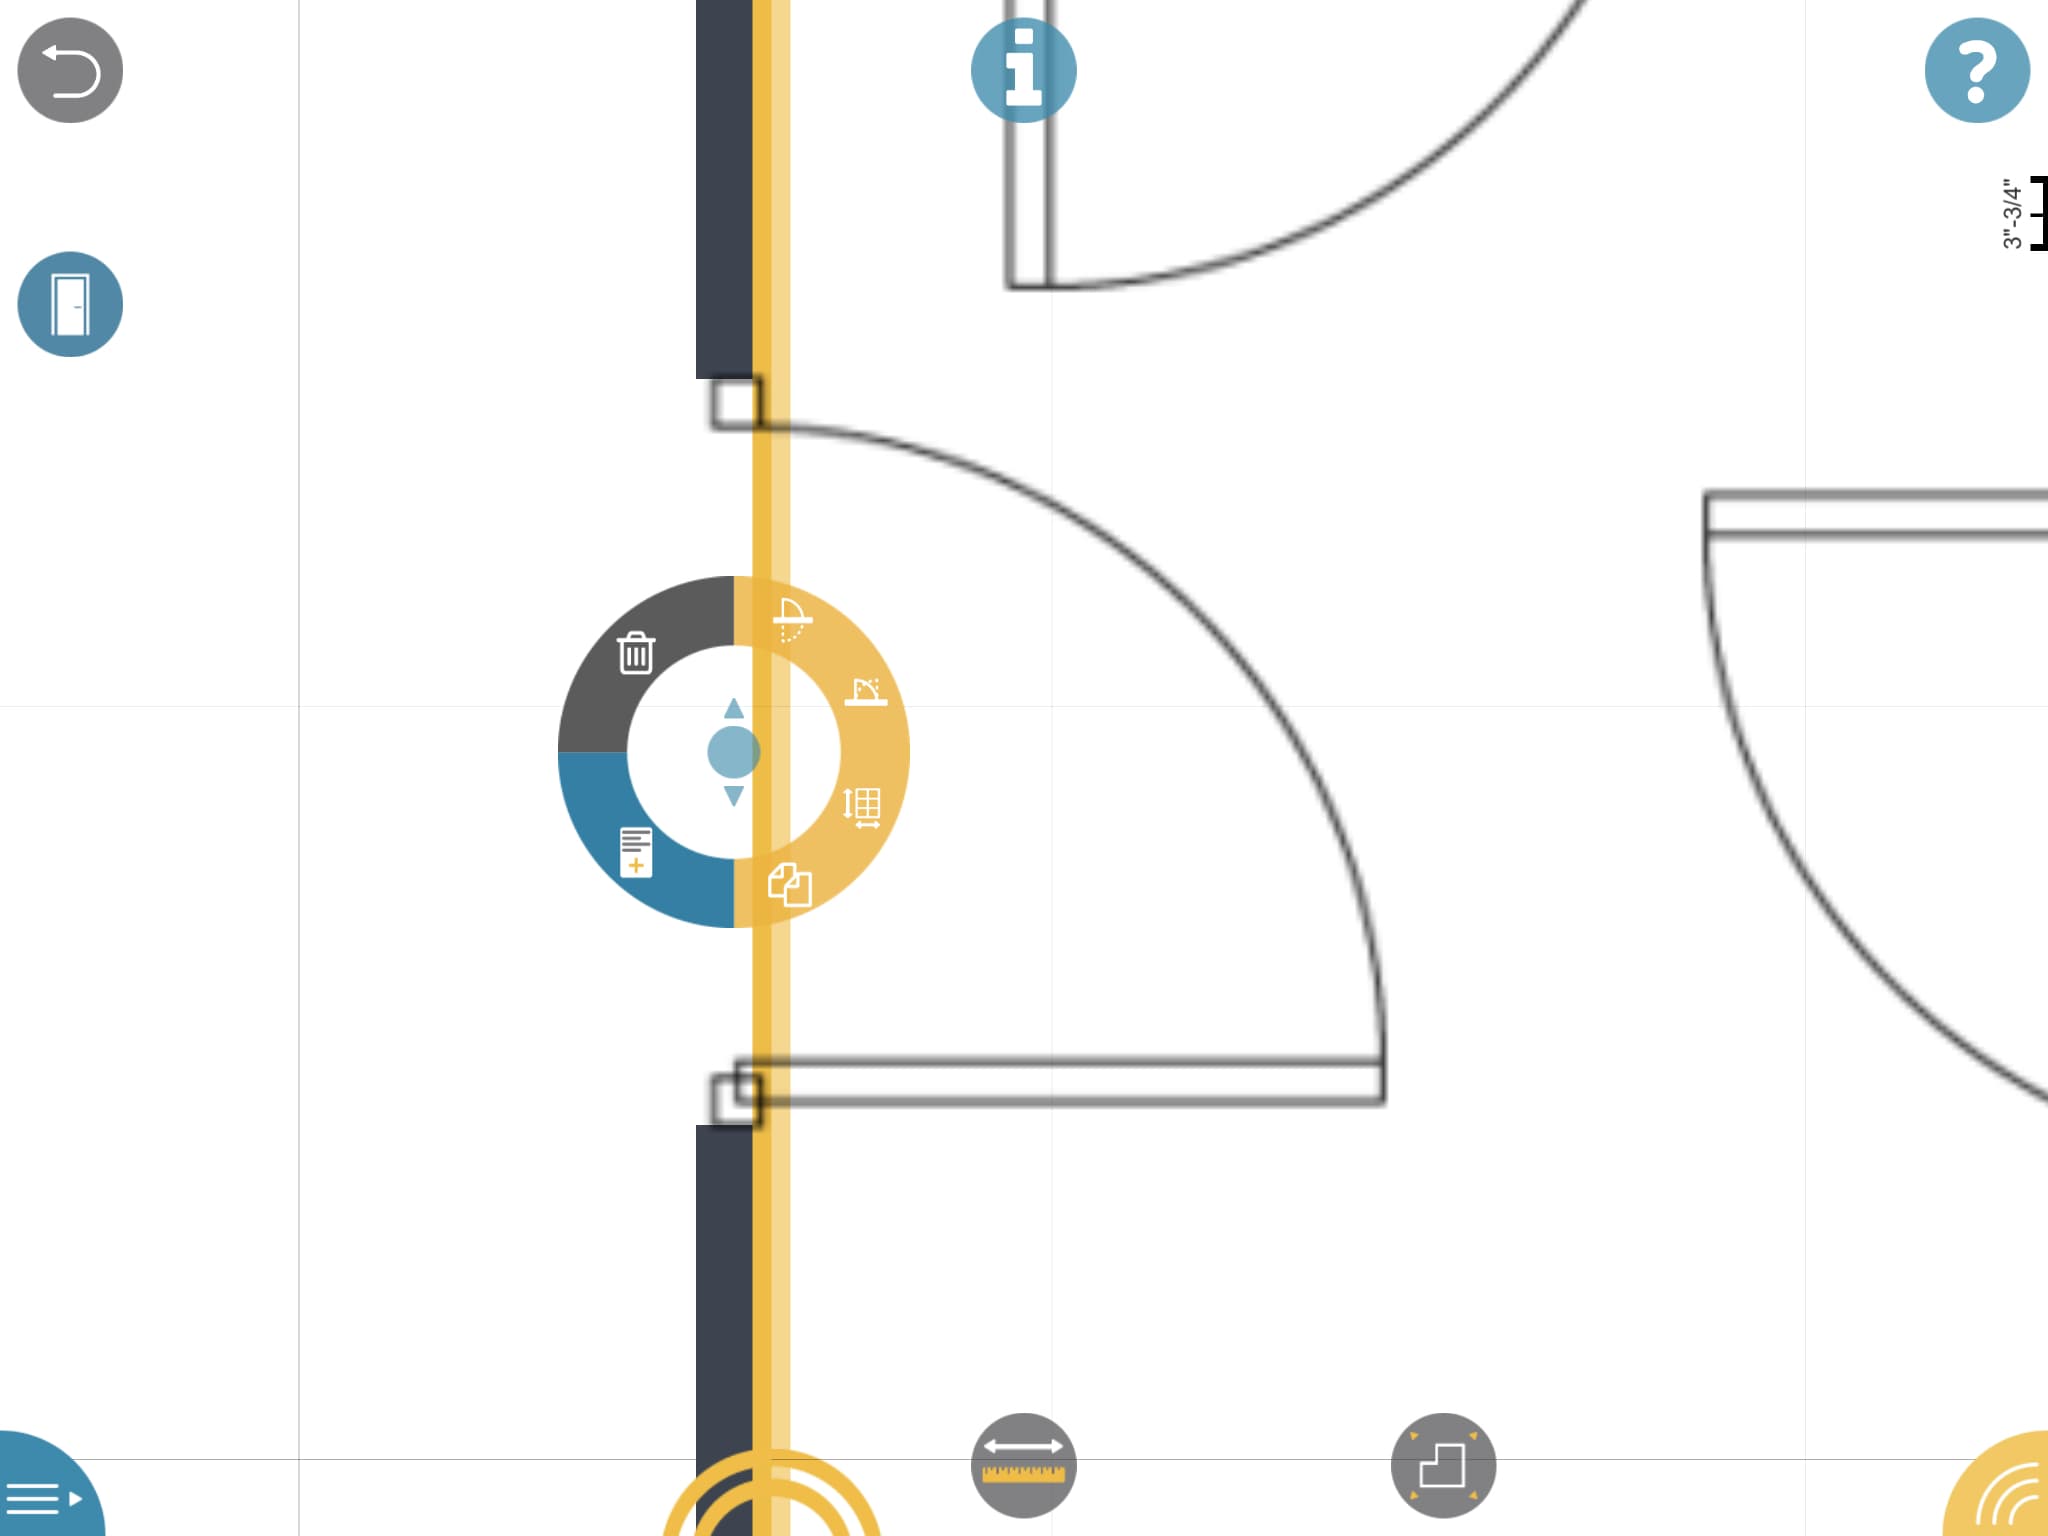
The next step is to select the “pencil” tool or the “door” tool and tap the area defining the center of the door in the wall. A circular (donut shaped) dialog will pop up with 6 buttons. Four buttons are in the yellow zone, while one is in the blue zone and the trash can button is in a dark gray zone. (see image 14)
By the way, “blue” as a color in OrthoGraph I’s user-interface stands for information and also distinguishes the main menu from the main Toolbar fan wheel. In image 15, the first yellow icon shows the door flipping to the other side of the wall. The next icon flips the swing direction only. The next icon looks like a grid with dimension control—it changes the size of the door. The next icon looks like two documents on top of each other–it copies and paste the door into the next point you touch on a wall. (see image 15)

16 – The blue doc looking icon takes you to this properties sheet for that door.
The blue icon will enable us to view and edit data about the door. (see image 16) You can also enter a barcode and take a picture and provide custom properties. Finally, the trash can icon deletes the door altogether.
Using the Leica Disto D2 For Measurement Input
The only difference in using your LDM for inputting dimensional values in your OrthoGraph I survey app is that when you drag between two points, like described and shown above, you do so while your LDM device is connected to the app. To make sure the LDM is connected turn it on and make sure Bluetooth is activated. Next, hit the “Main menu” button. Then select “Connect to” and choose a device manufacturer. OrthoGraph I will list devices it finds. Select yours. It will turn yellow and say “Connected.” (see image 17)
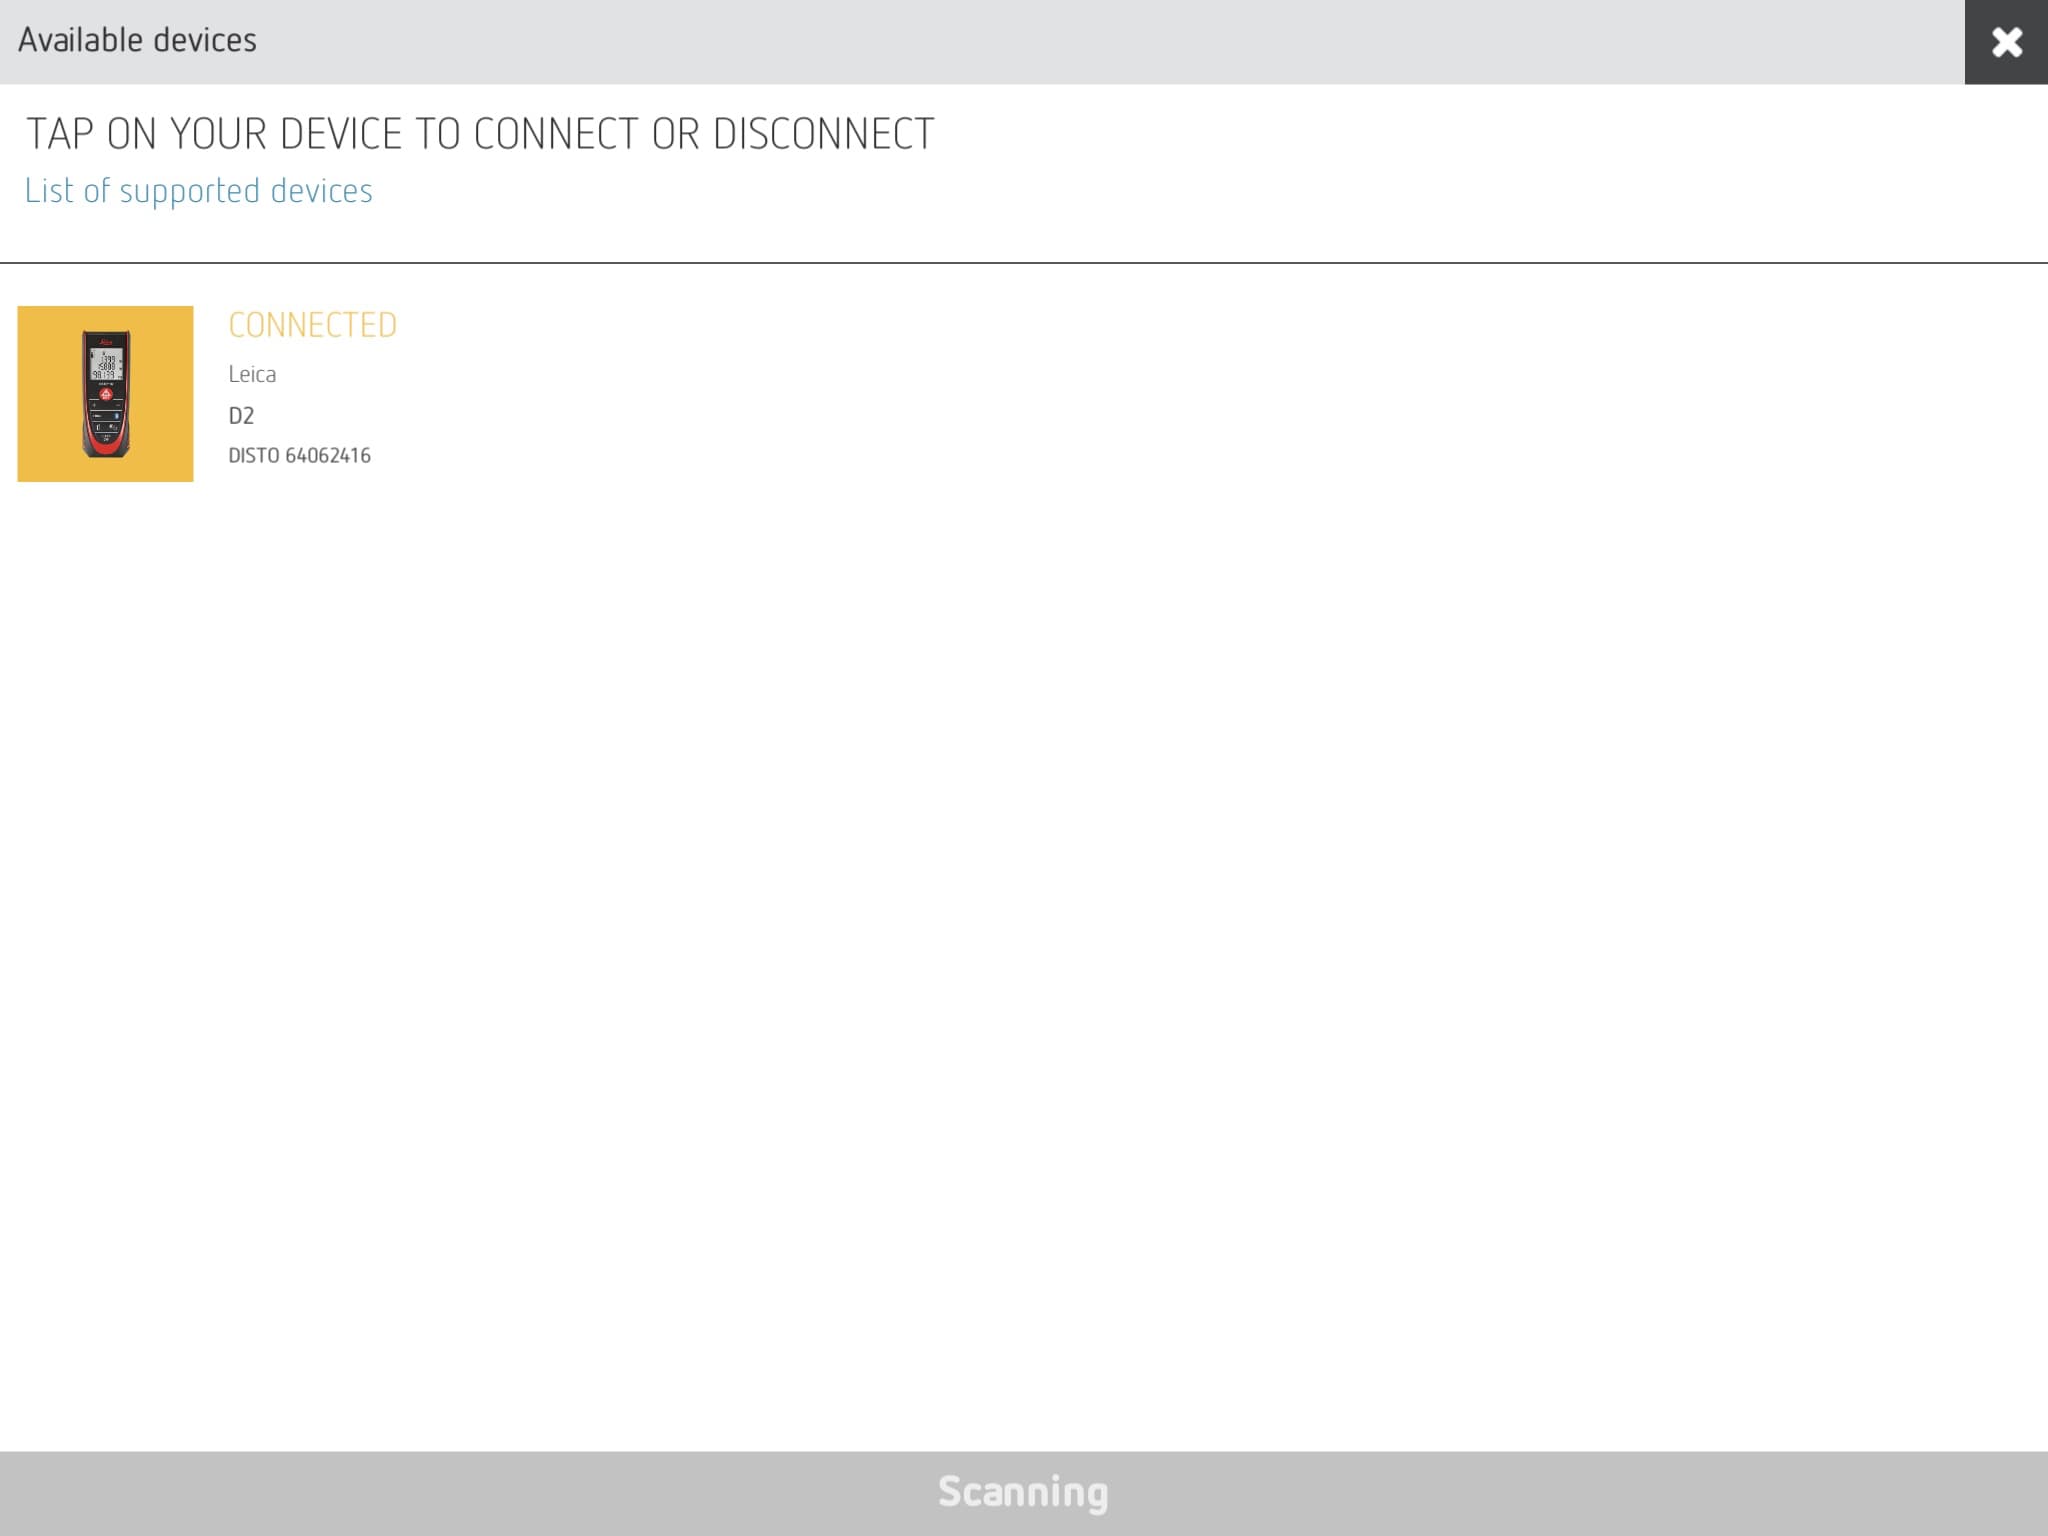
17 – This is what OrthoGraph I looks like once your Bluetooth LDM is connected to the app.
Hit the “X” button to close the setup window and you are returned to the drawing screen. Zoom into a wall you want to measure. Tap the measurement icon (it turns blue). The anchor point and the second measurement point (the two vertices) are highlighted as shown in this image below. (see image 18) A dimension is currently displayed but once you shoot your laser device and hit the conclude button on the device, that “value” is wirelessly sent to the app and the value is changed in the app dialog. Select the confirmation checkbox button (in yellow) to confirm. The drawing changes automatically to reflect the new position and values.
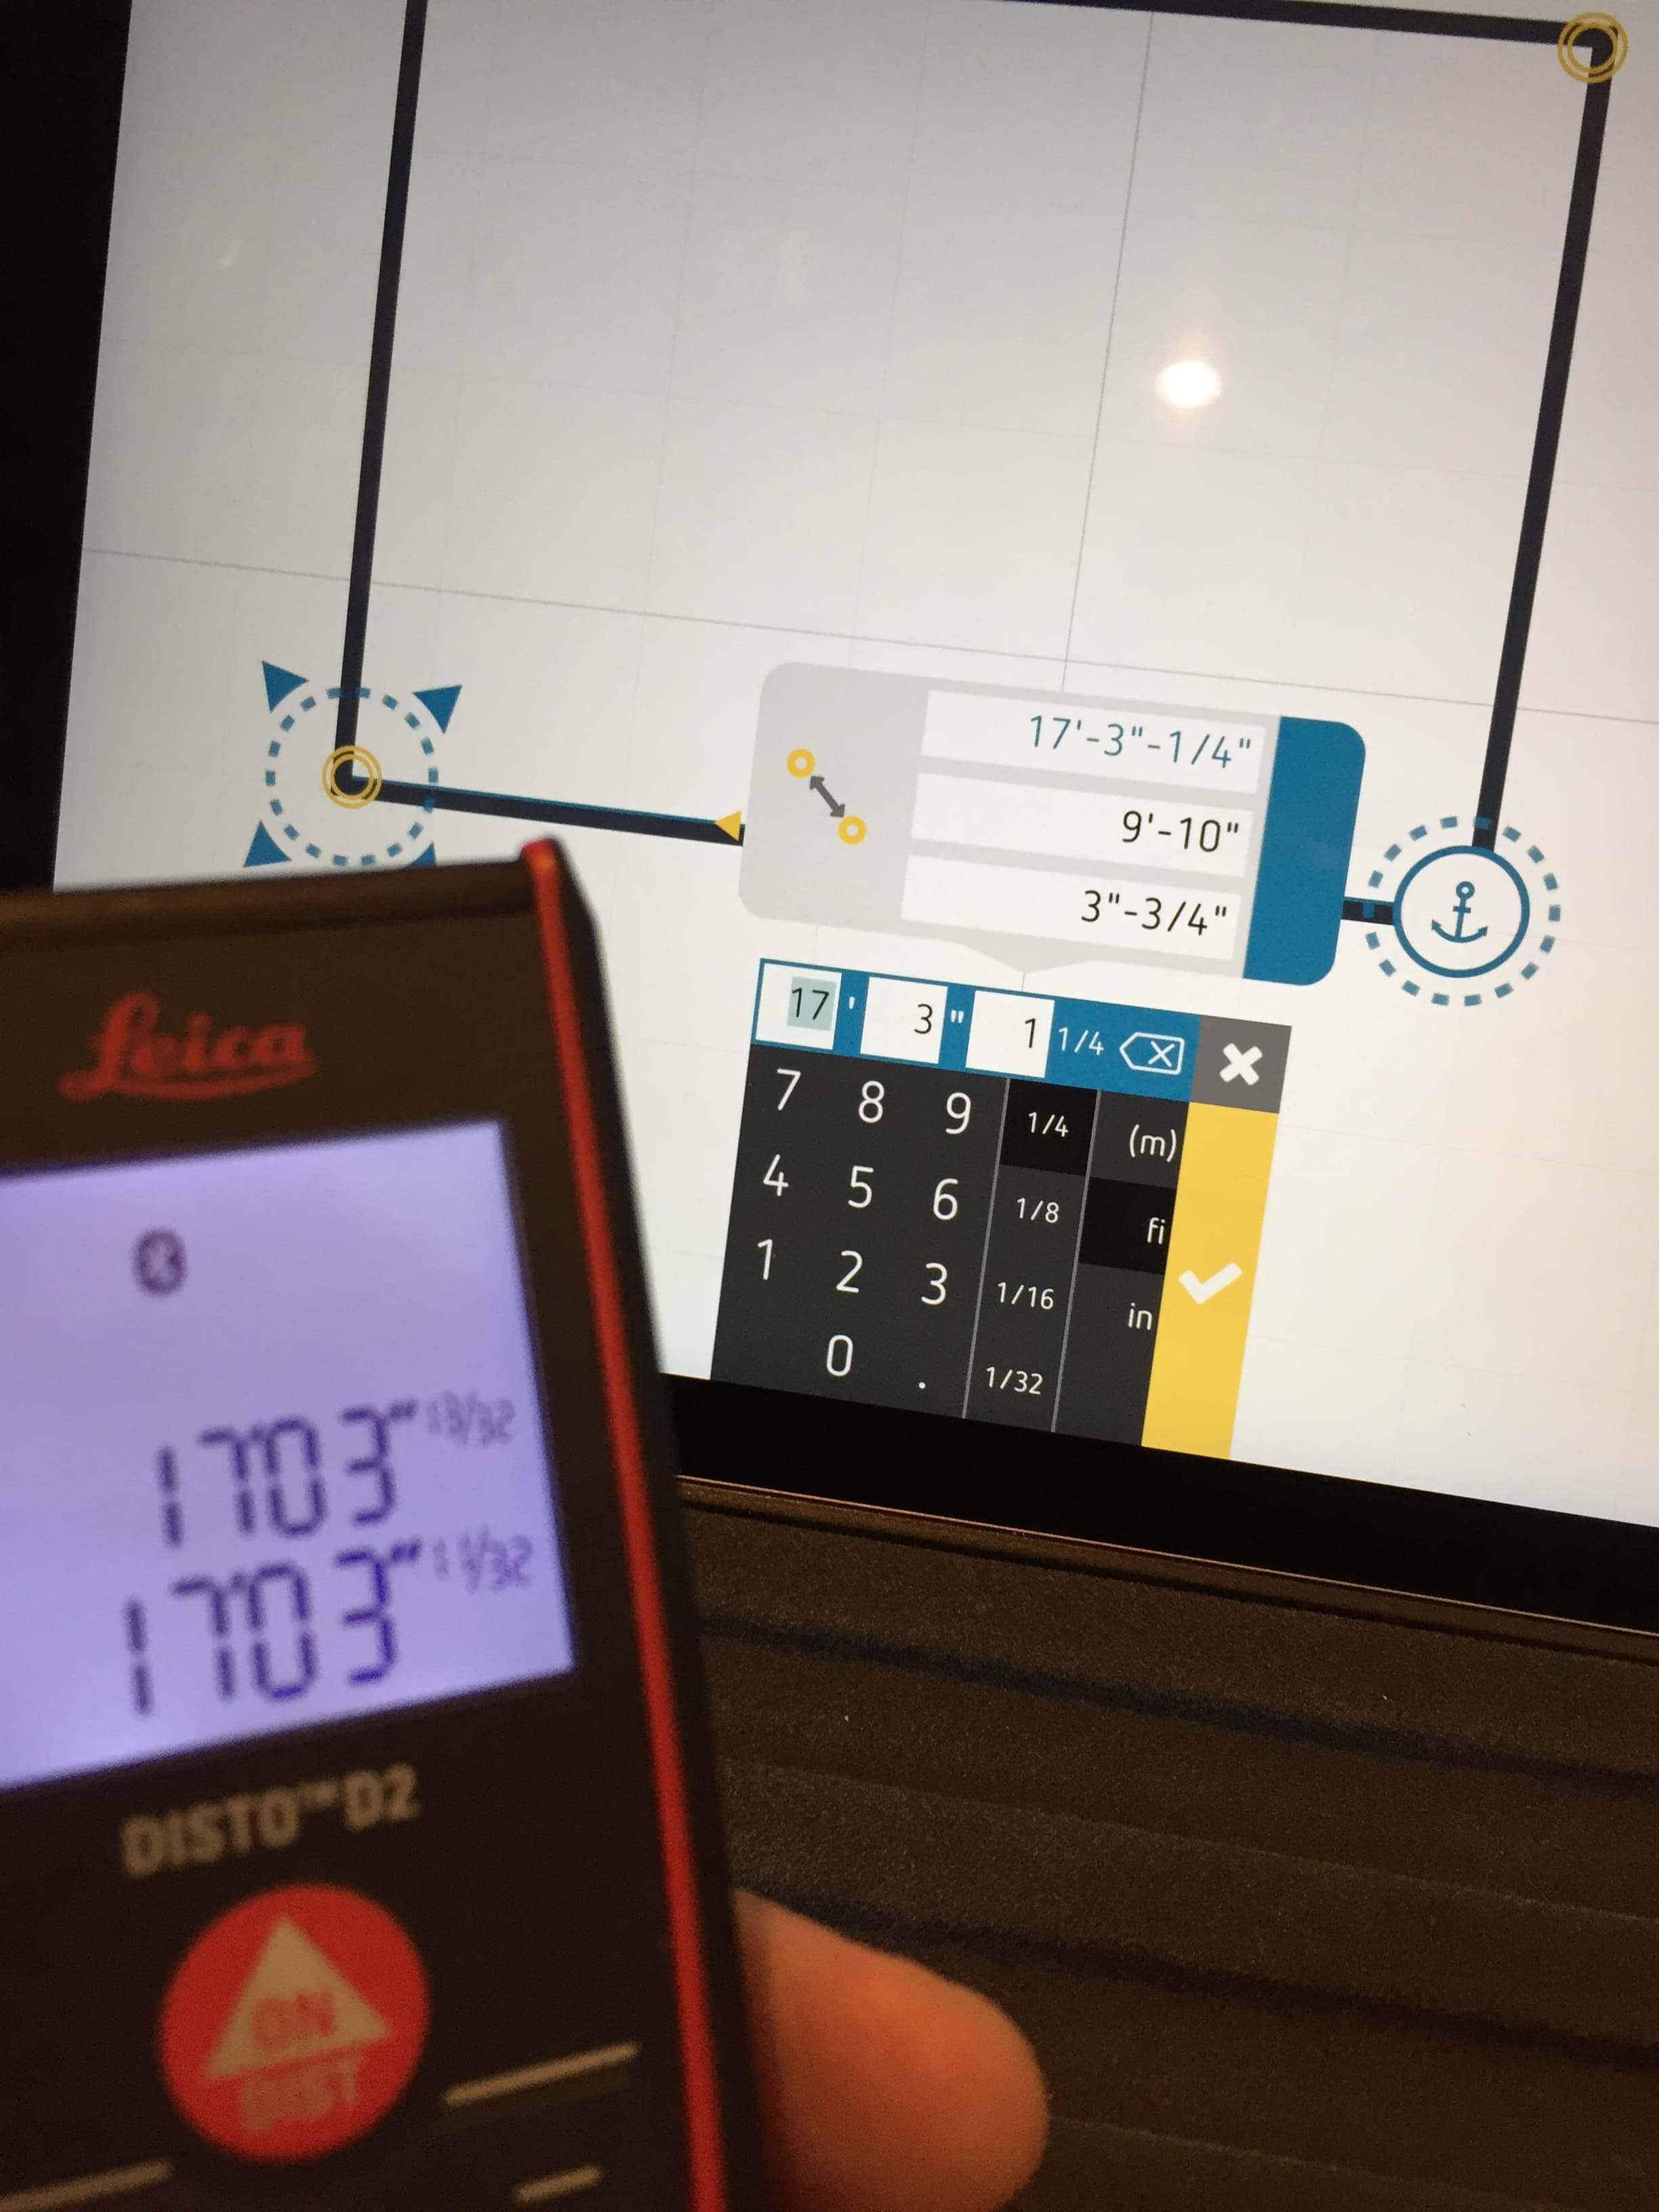
18 – Successfully connected you take laser measurements, in my case with my Leica Disto D2, during the measuring input process. The distance values from the device are sent to the app wirelessly. So cool!
Repeating this process you can rapidly measure (survey) huge rooms all by yourself, including rooms that include hazards you can’t walk by or over, or span over large openings to below or gaps in structural floors due to fires or other destruction. This app actually improves safety at the building site because you use the laser to span over areas you should not be trying to span over with your body and limbs.
You can locate doors and windows in your walls the same way. Select the “Object” icon, then the “Door” icon, then hit a wall where the door should be. Then hit the measurement icon (it turns blue). The door object has two vertices defining its left and right edges of the door (or frame size but not inclusive of the frame). Again, using the LDM device start the process of measurement and obtain the dimensions by aiming (placing) the LDM at the left edge of the door and then pointing back toward the wall. For the D2 you have choices for where the dimension starts—from the back or front of the device. I prefer the back. Placing the device back in alignment with the door shoot the laser dimension.
next page: Wall Thickness and Windows & Exporting Data
Wall Thickness and Windows
AEC professionals want to be able to produce building surveys quickly with an end-product that is instantly useful to their process. We have thus far covered creating the shape of a room, producing a series of rooms, including with angles and attaching these rooms. Locating the common door precisely aids our process in merging (combining) discrete rooms together. Next, we will explore the window insertion tools and wall thickness tools.
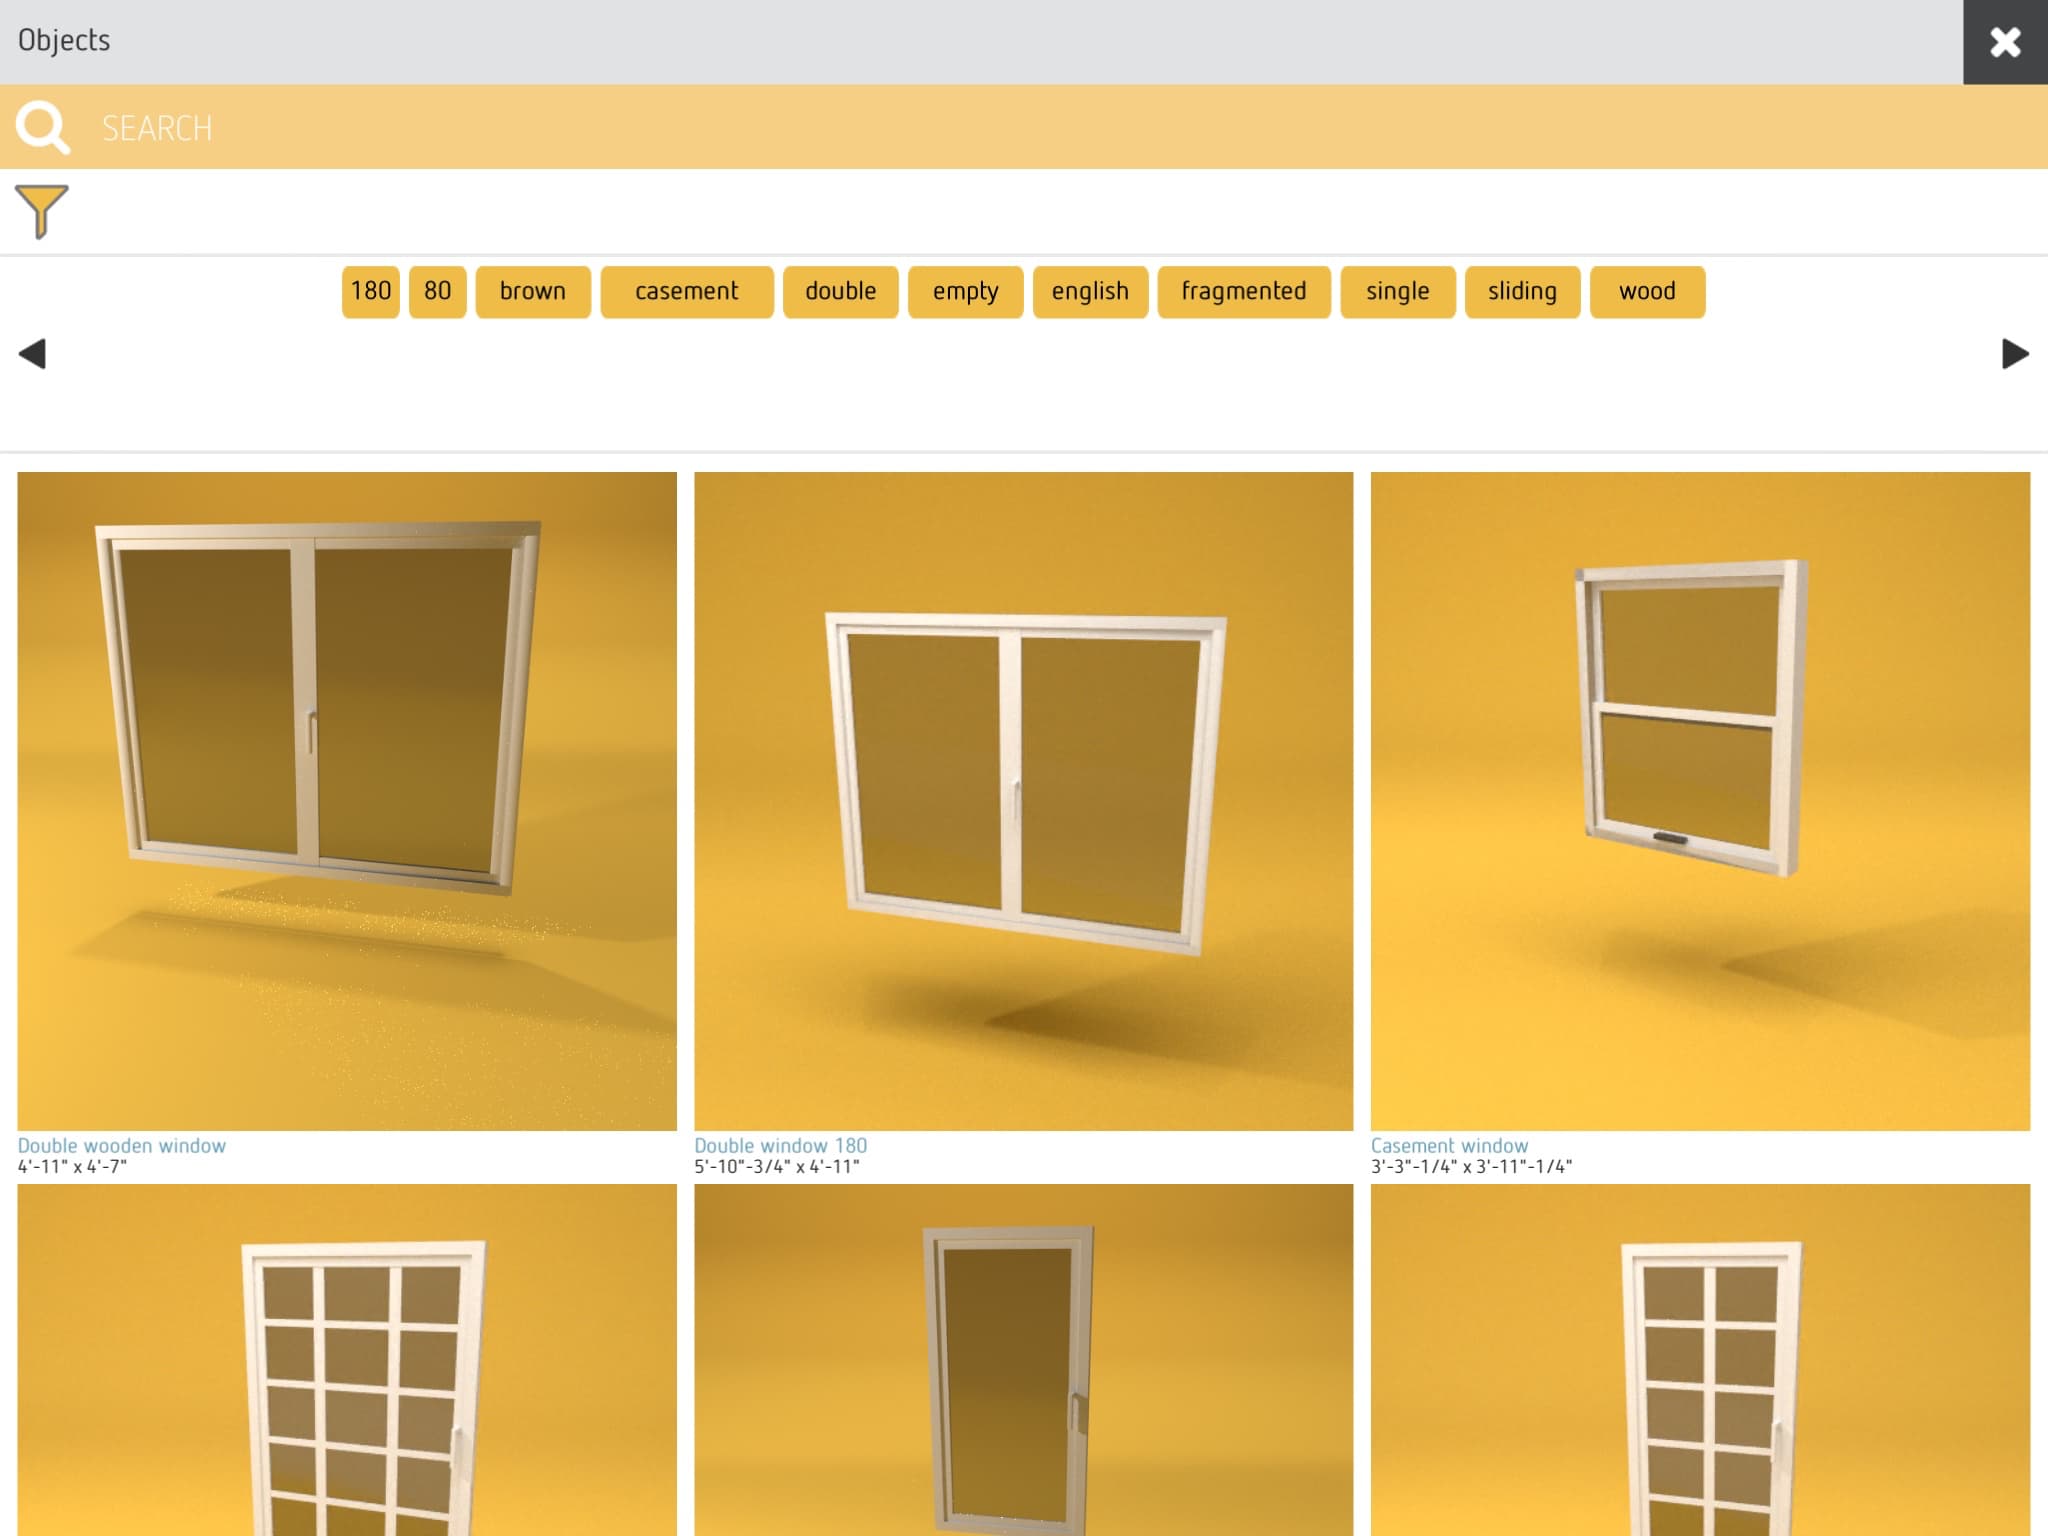
19 – The Window library in OrthoGraph I.
20 – In this 3D view in OrthoGraph I we can see we have different windows by accident in the same room.
The process is nearly identical to a door. Tap on the Toolbar fan wheel icon (lower right). Select the “Object” icon then the “Window” icon. A window icon blinks inside its circular button upper left, tap it and then select one of two window types or alternatively tap the “plus” icon in blue. This brings up the Window library in OrthoGraph I. (see image 19) . Tap on a spot on the wall to insert the new window. Next, access the Toolbar palette again and tap the “Orbit” rotation tool. Now we can see that we have different windows in the same room. (see image 20) We can fix that quickly copying and pasting the correct window and repeat that process for adding additional windows.
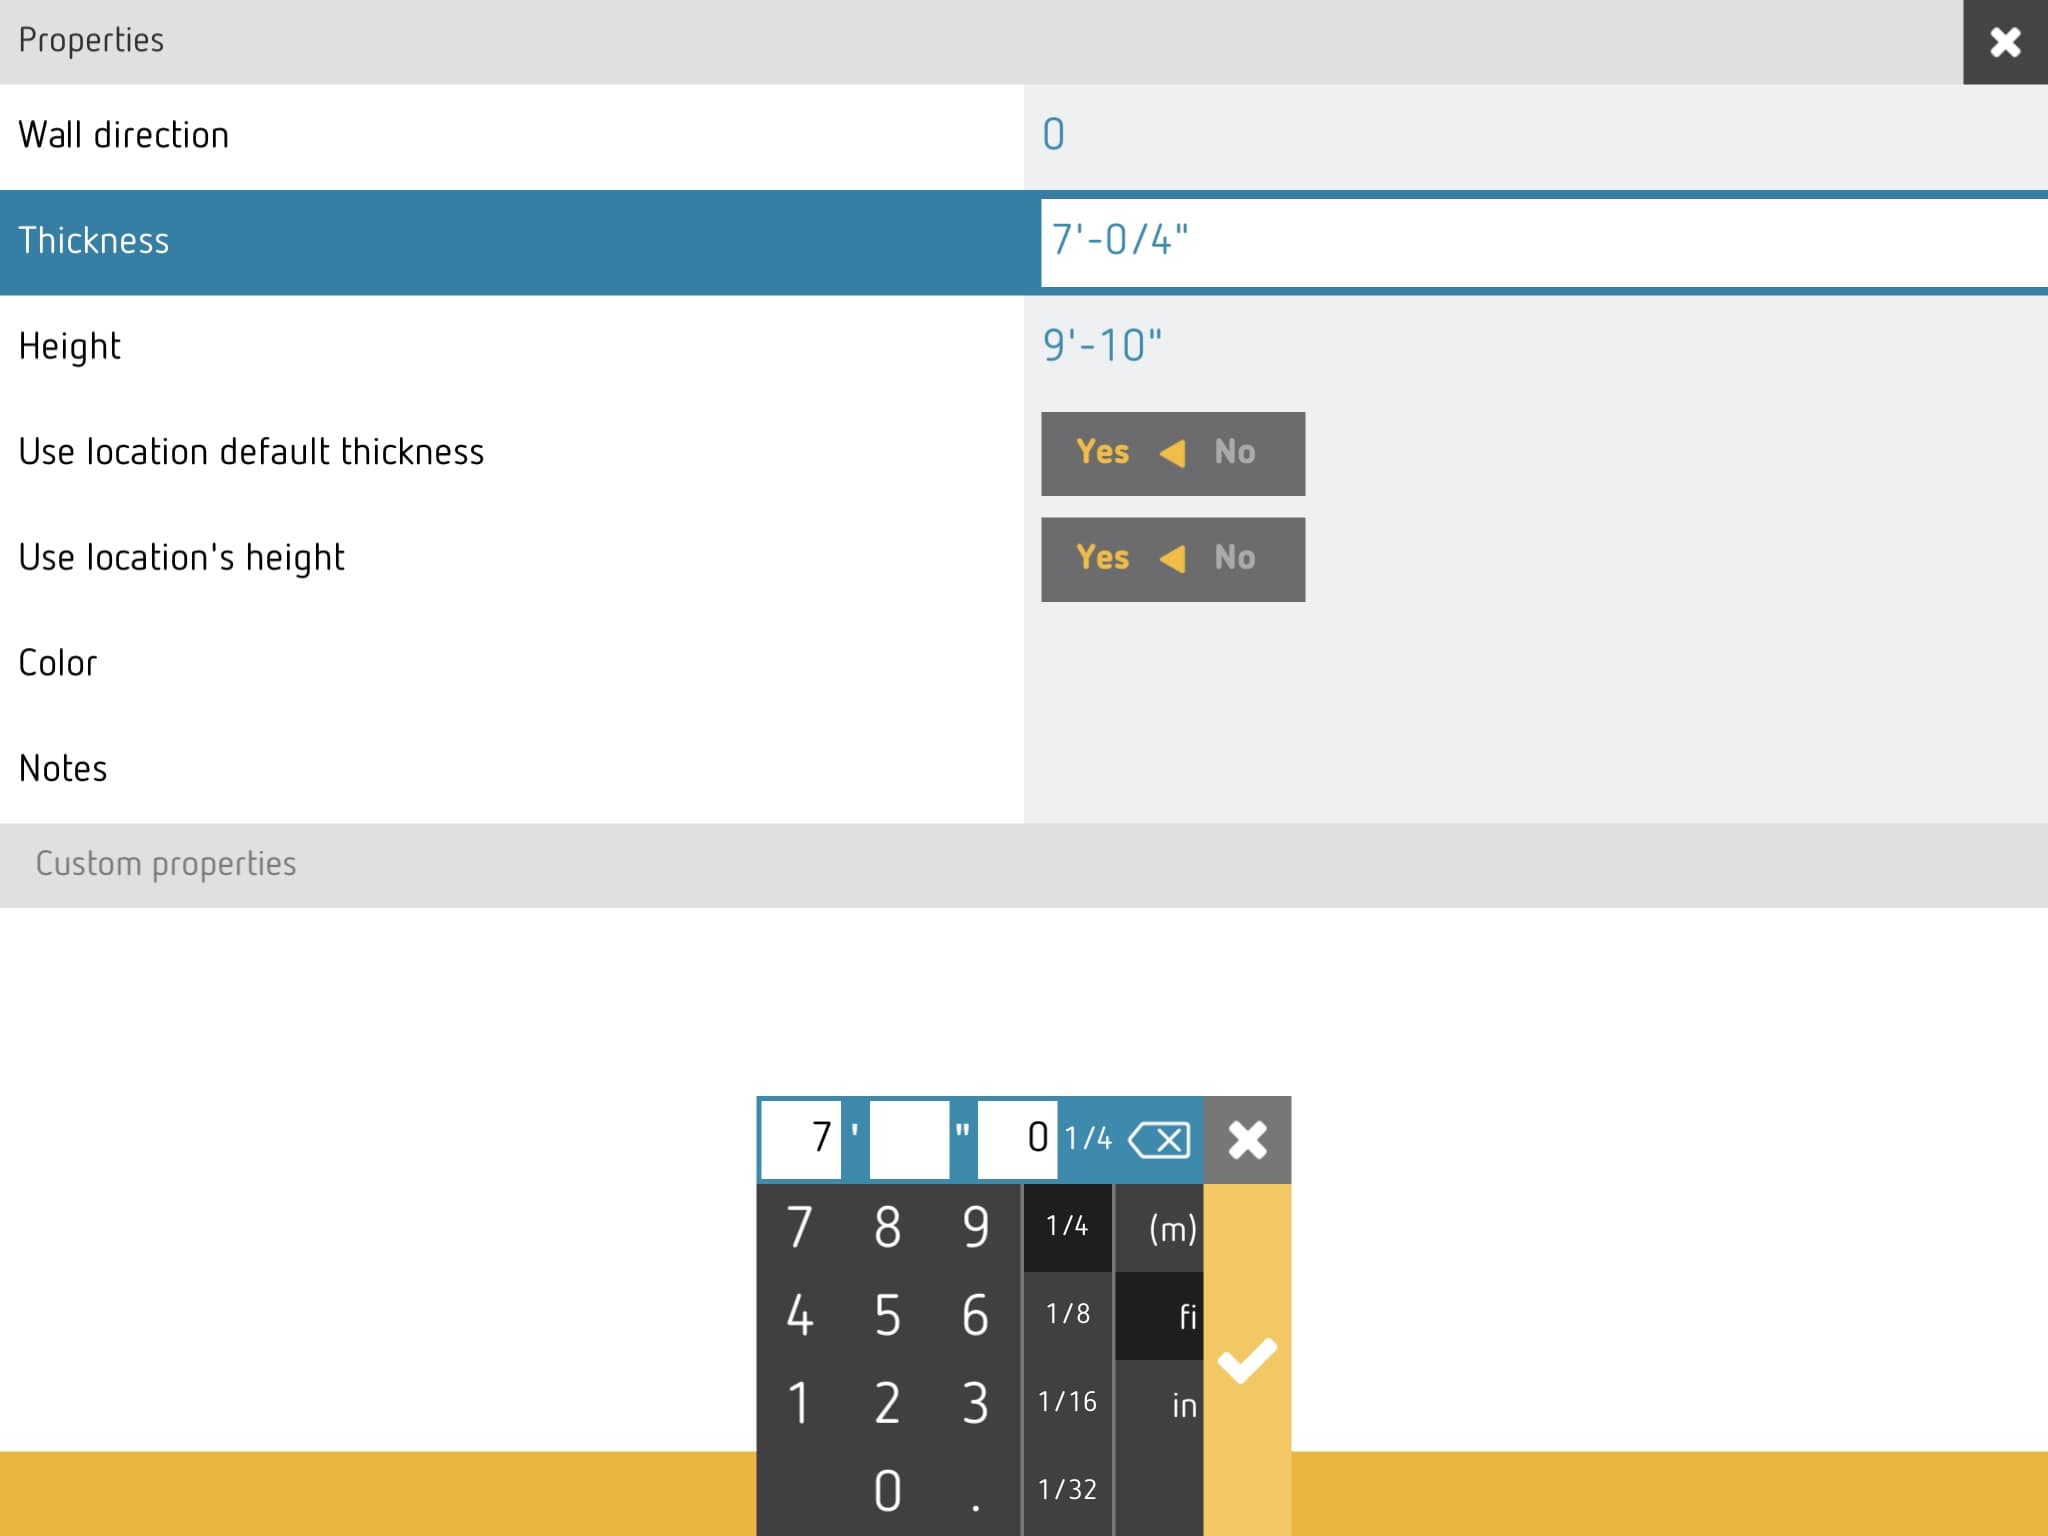
21 – Adding wall thickness, wall height, and other wall properties are easy.
To add a wall thickness single tap on a wall. Two small icons appear in blue buttons. One is for adding a control point (new vertex) and the other looks like a paper report. Select that one. The wall properties window popups up. Input a different thickness value based on actual survey values. (see image 21) Then hit the close “X” button.
Exporting the Data
Now that we have our surveyed building plan the next step is pushing it out into useful CAD and BIM geometry data (ie: floor plans or BIM model). Select the “Main menu” button lower left. Then tap the “Export” button. Highlight “DXF” in the interface and select “Single Layer.” Next hit the “Send” button below. Next, do the same again but this time send an IFC file. (see image 22)
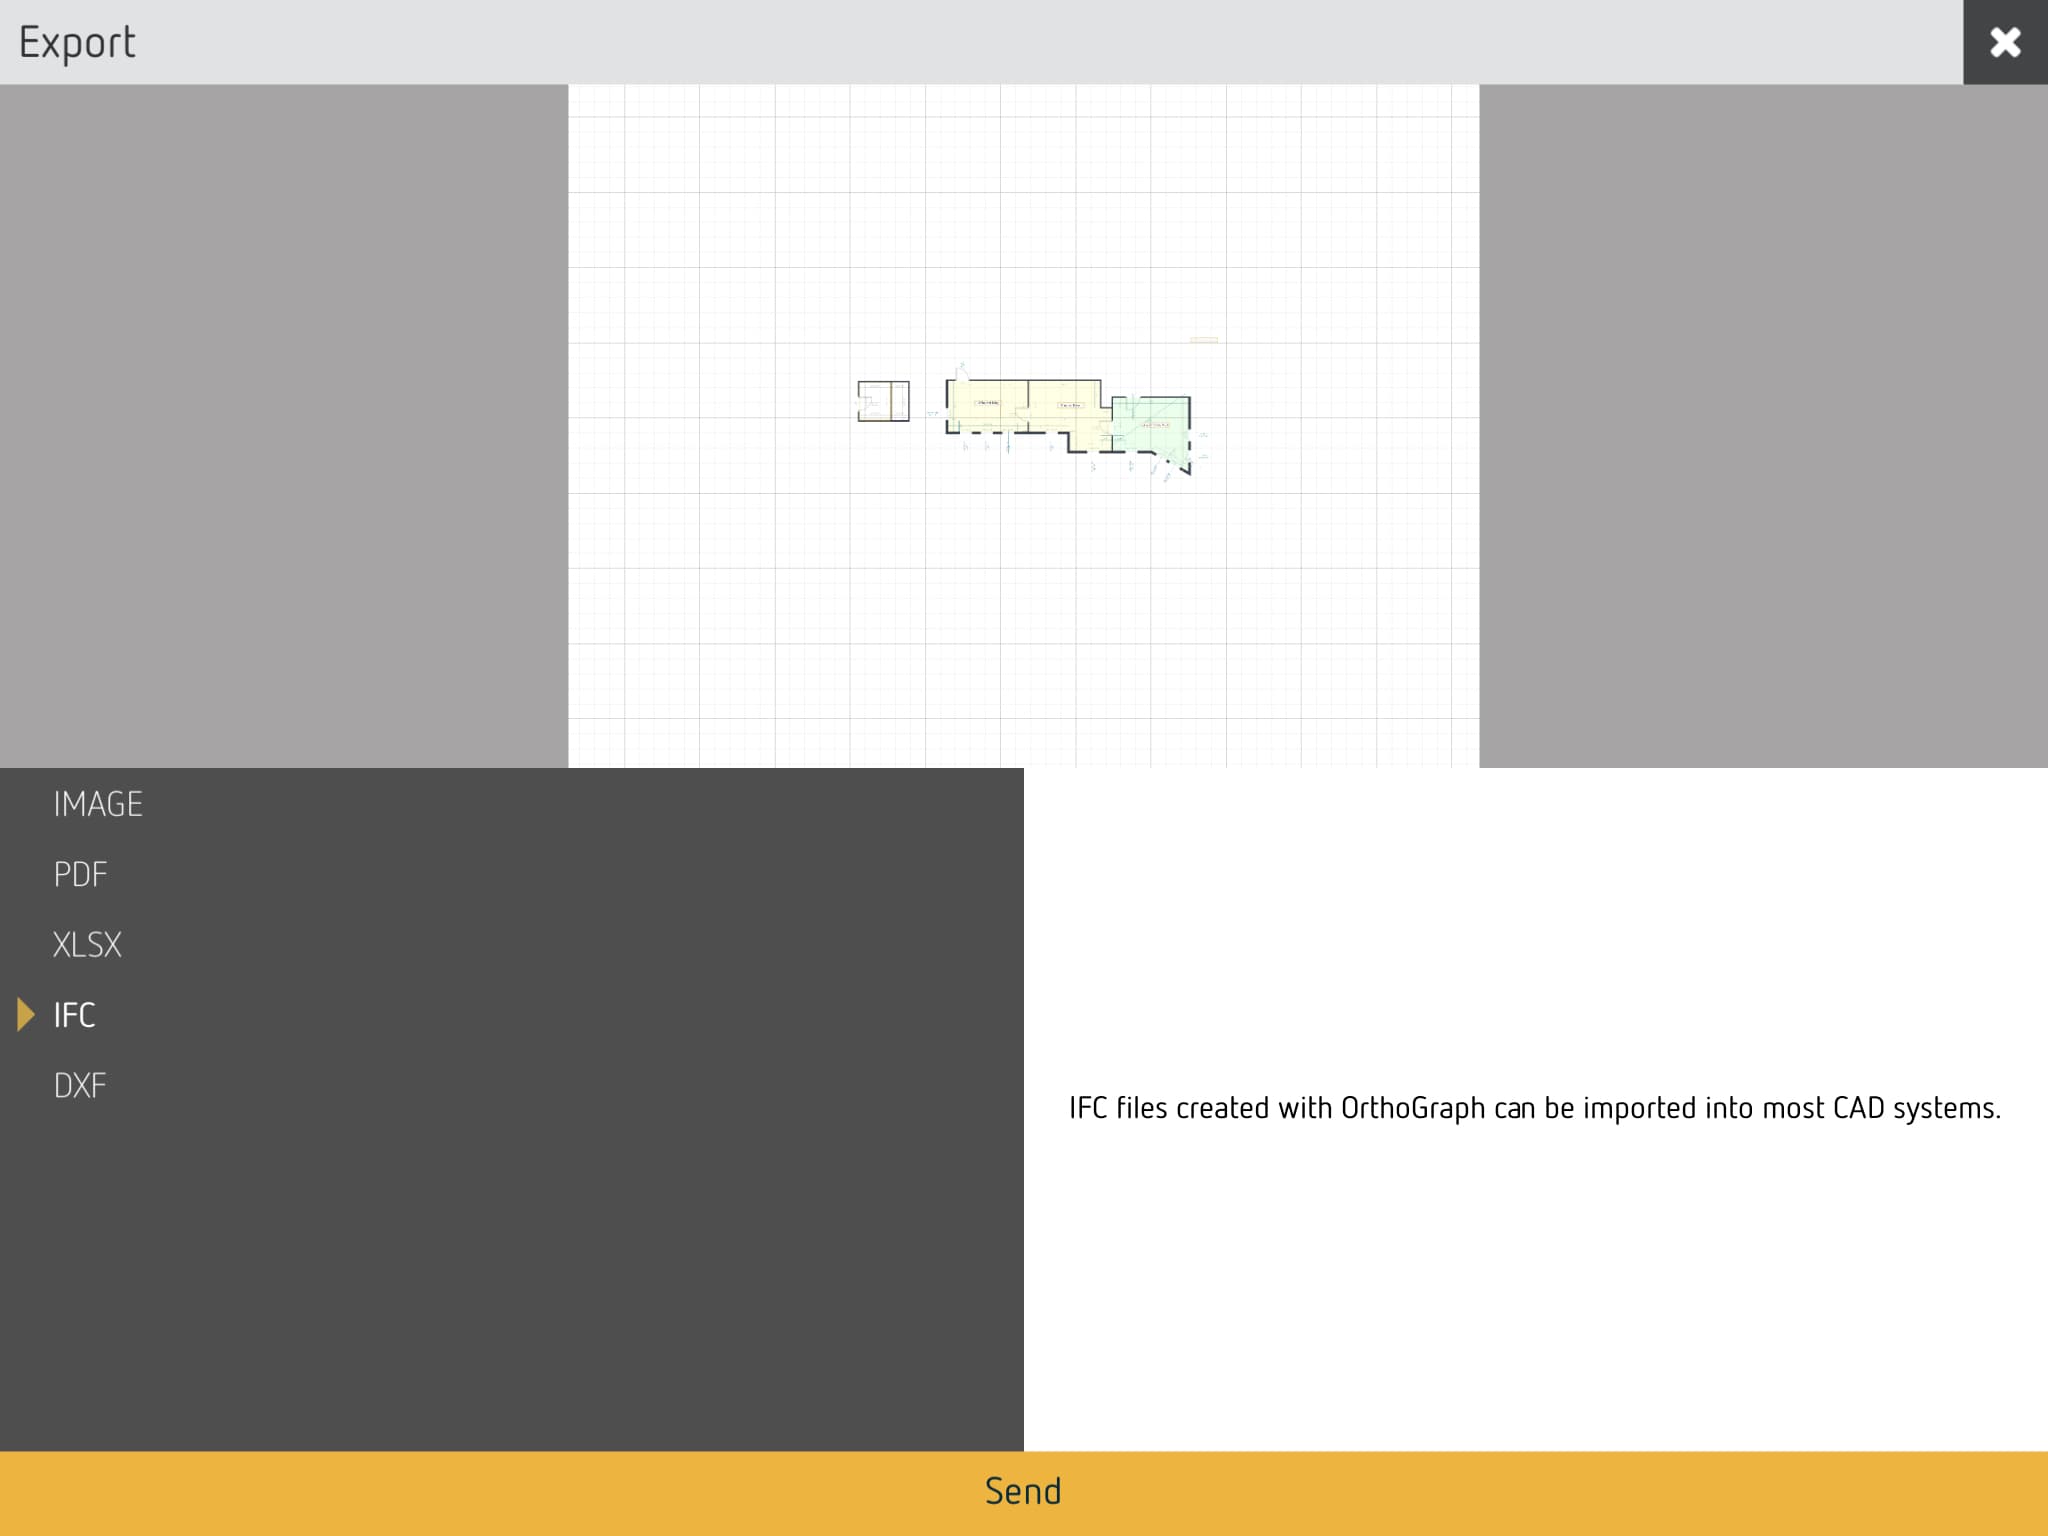
21 – Exporting out an IFC files for a BIM application.
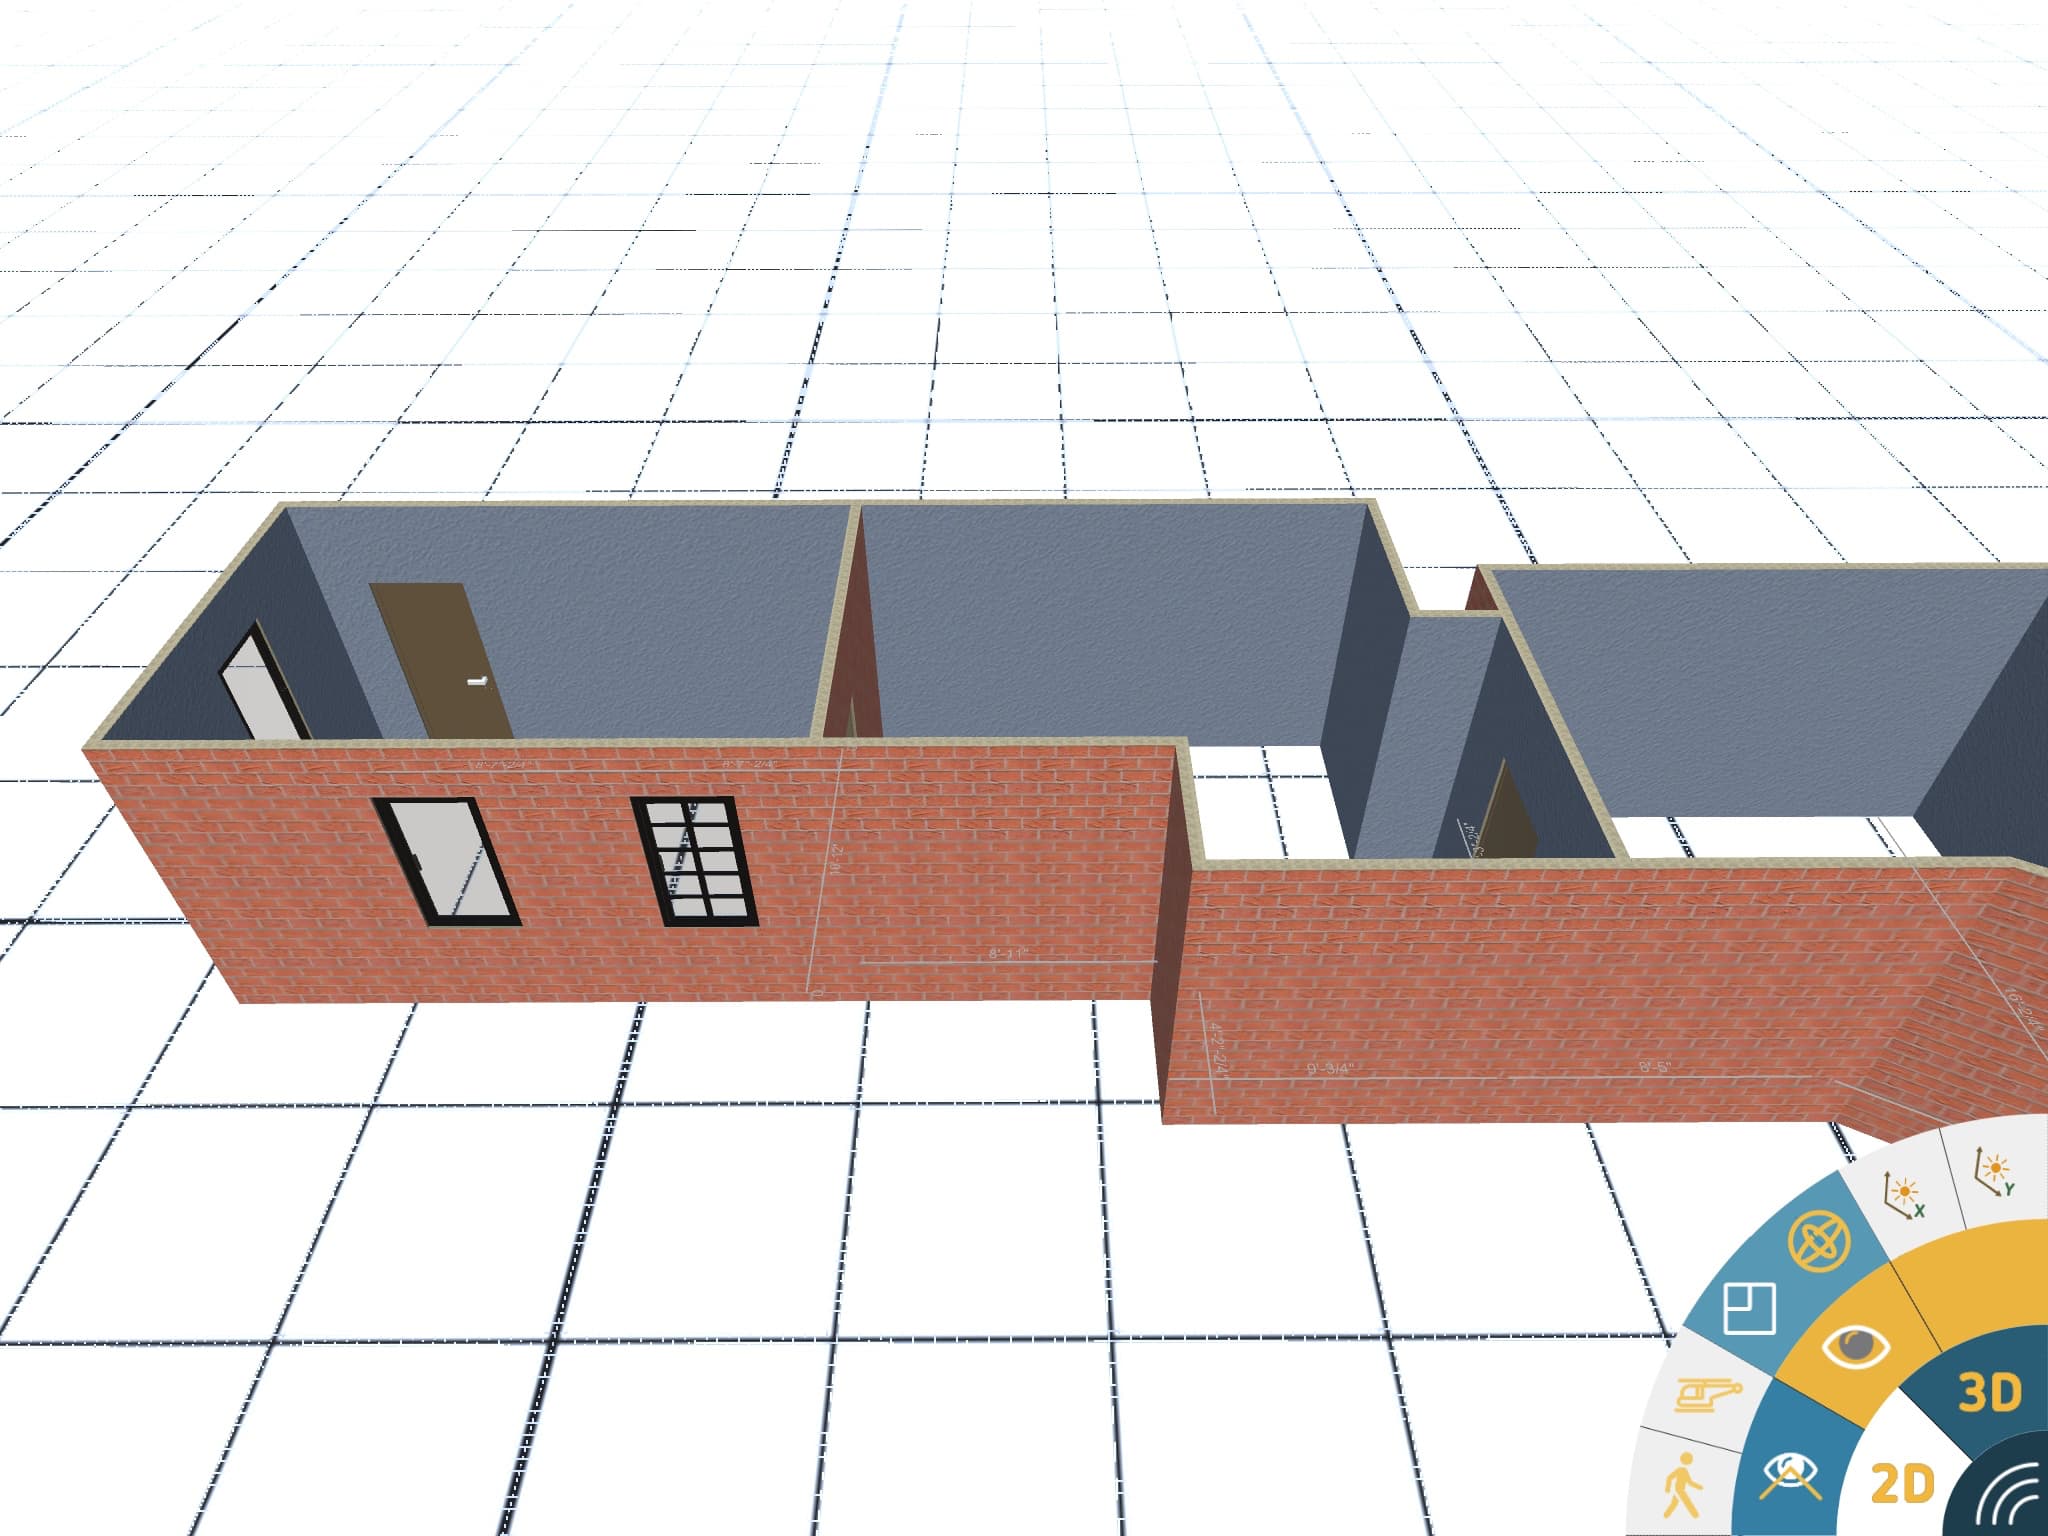
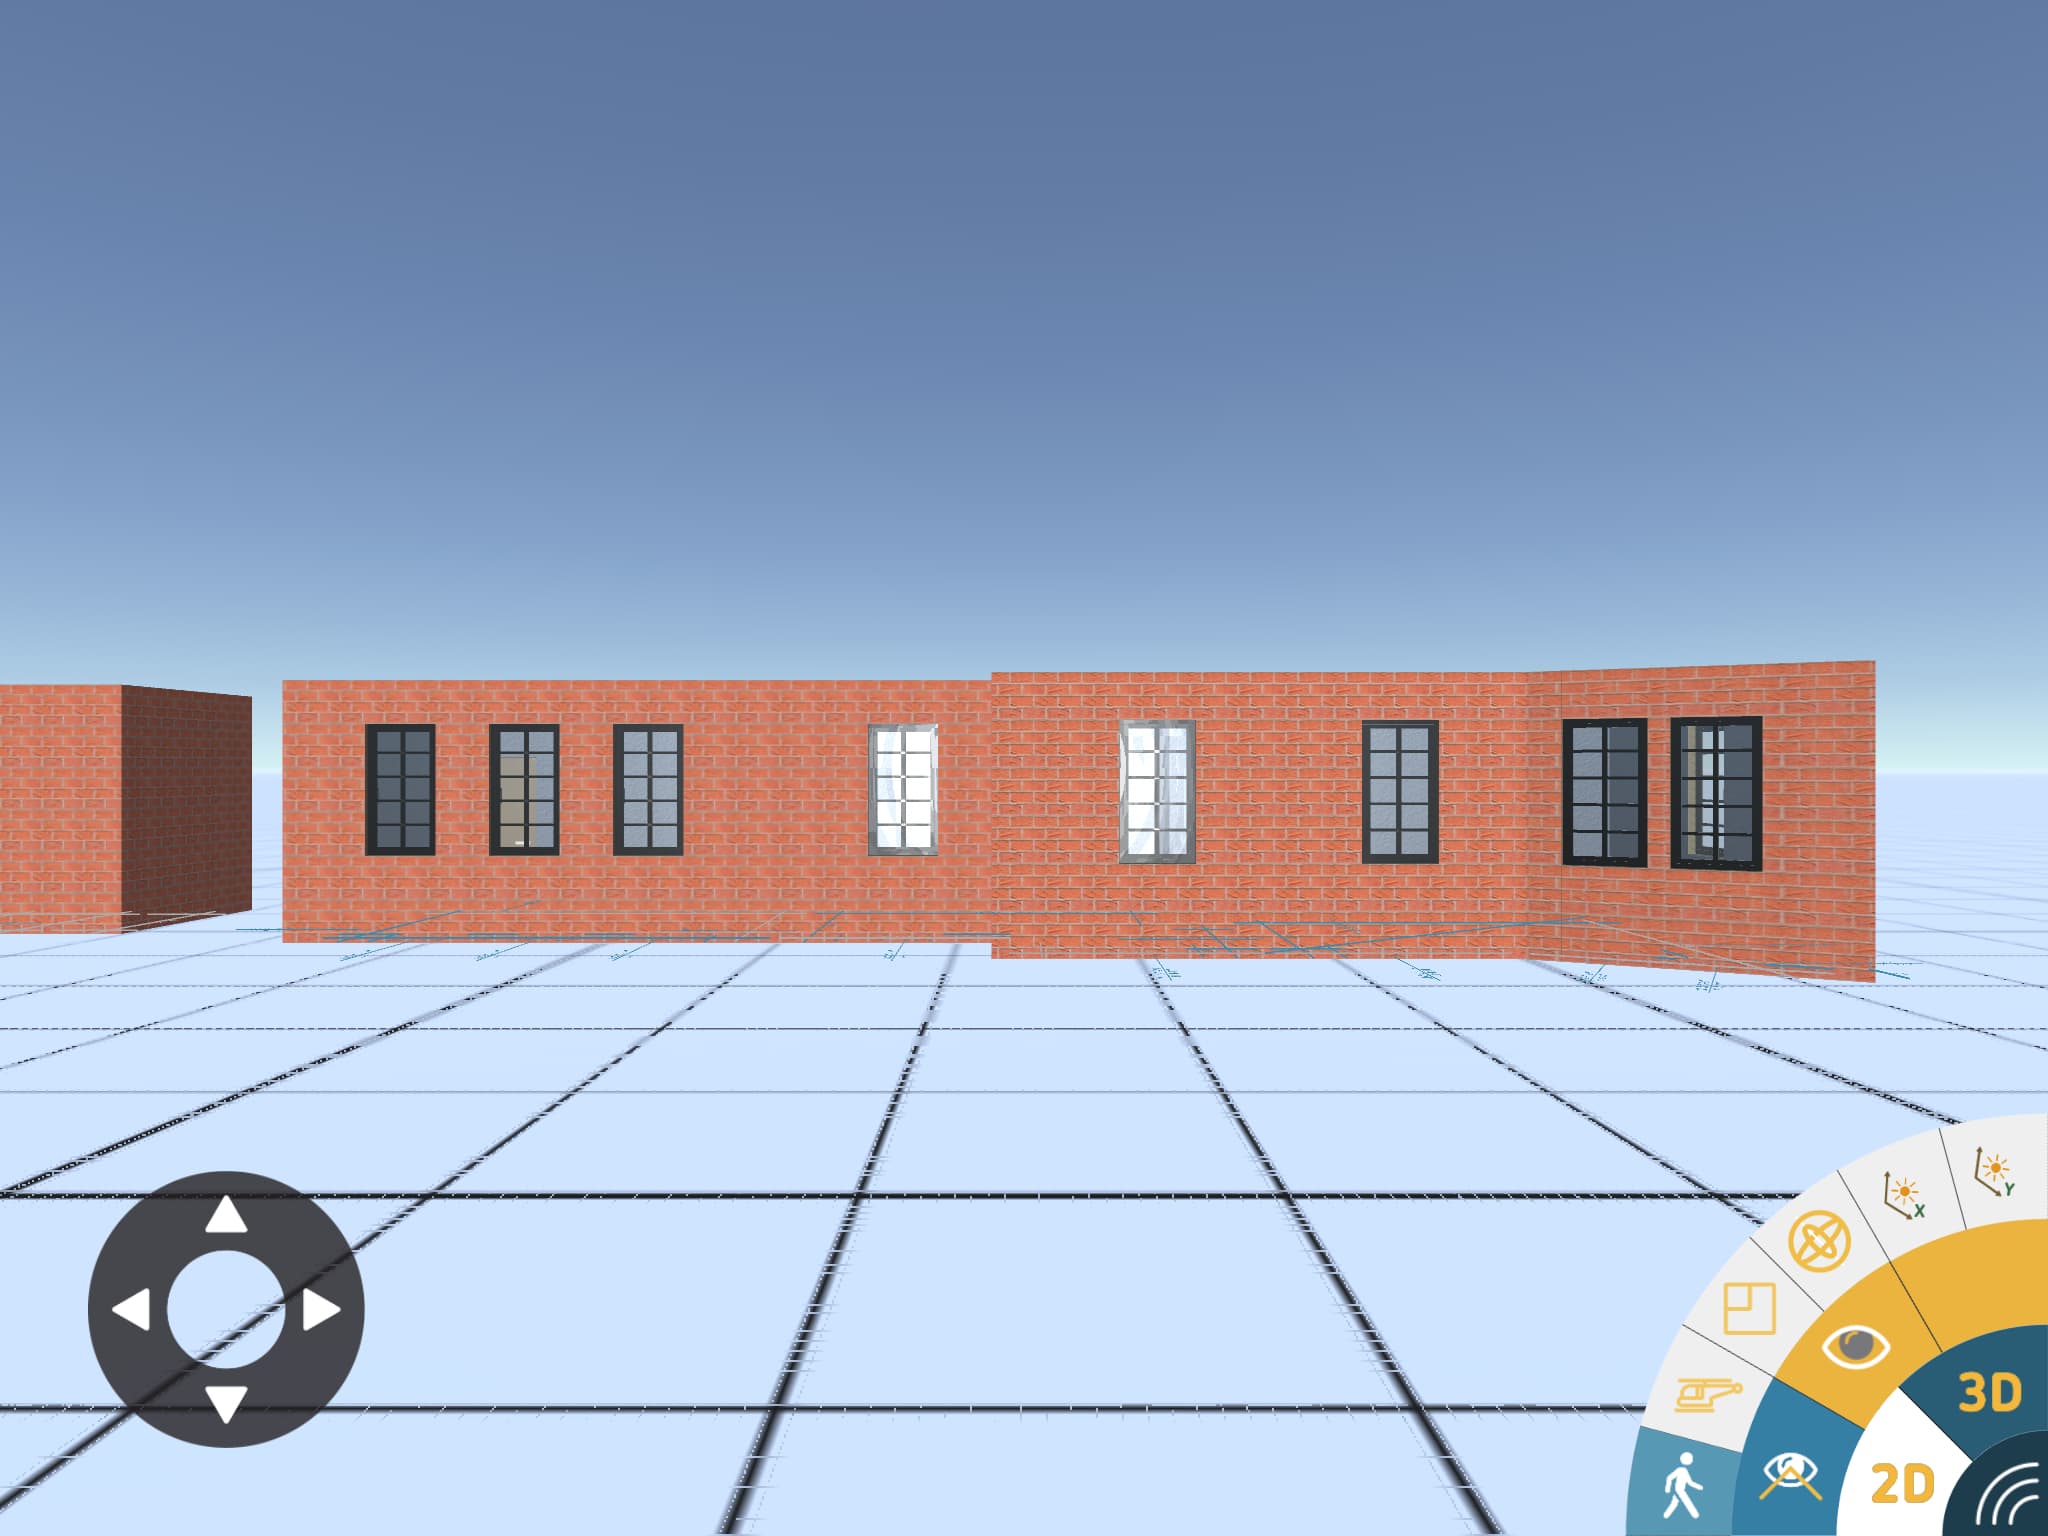
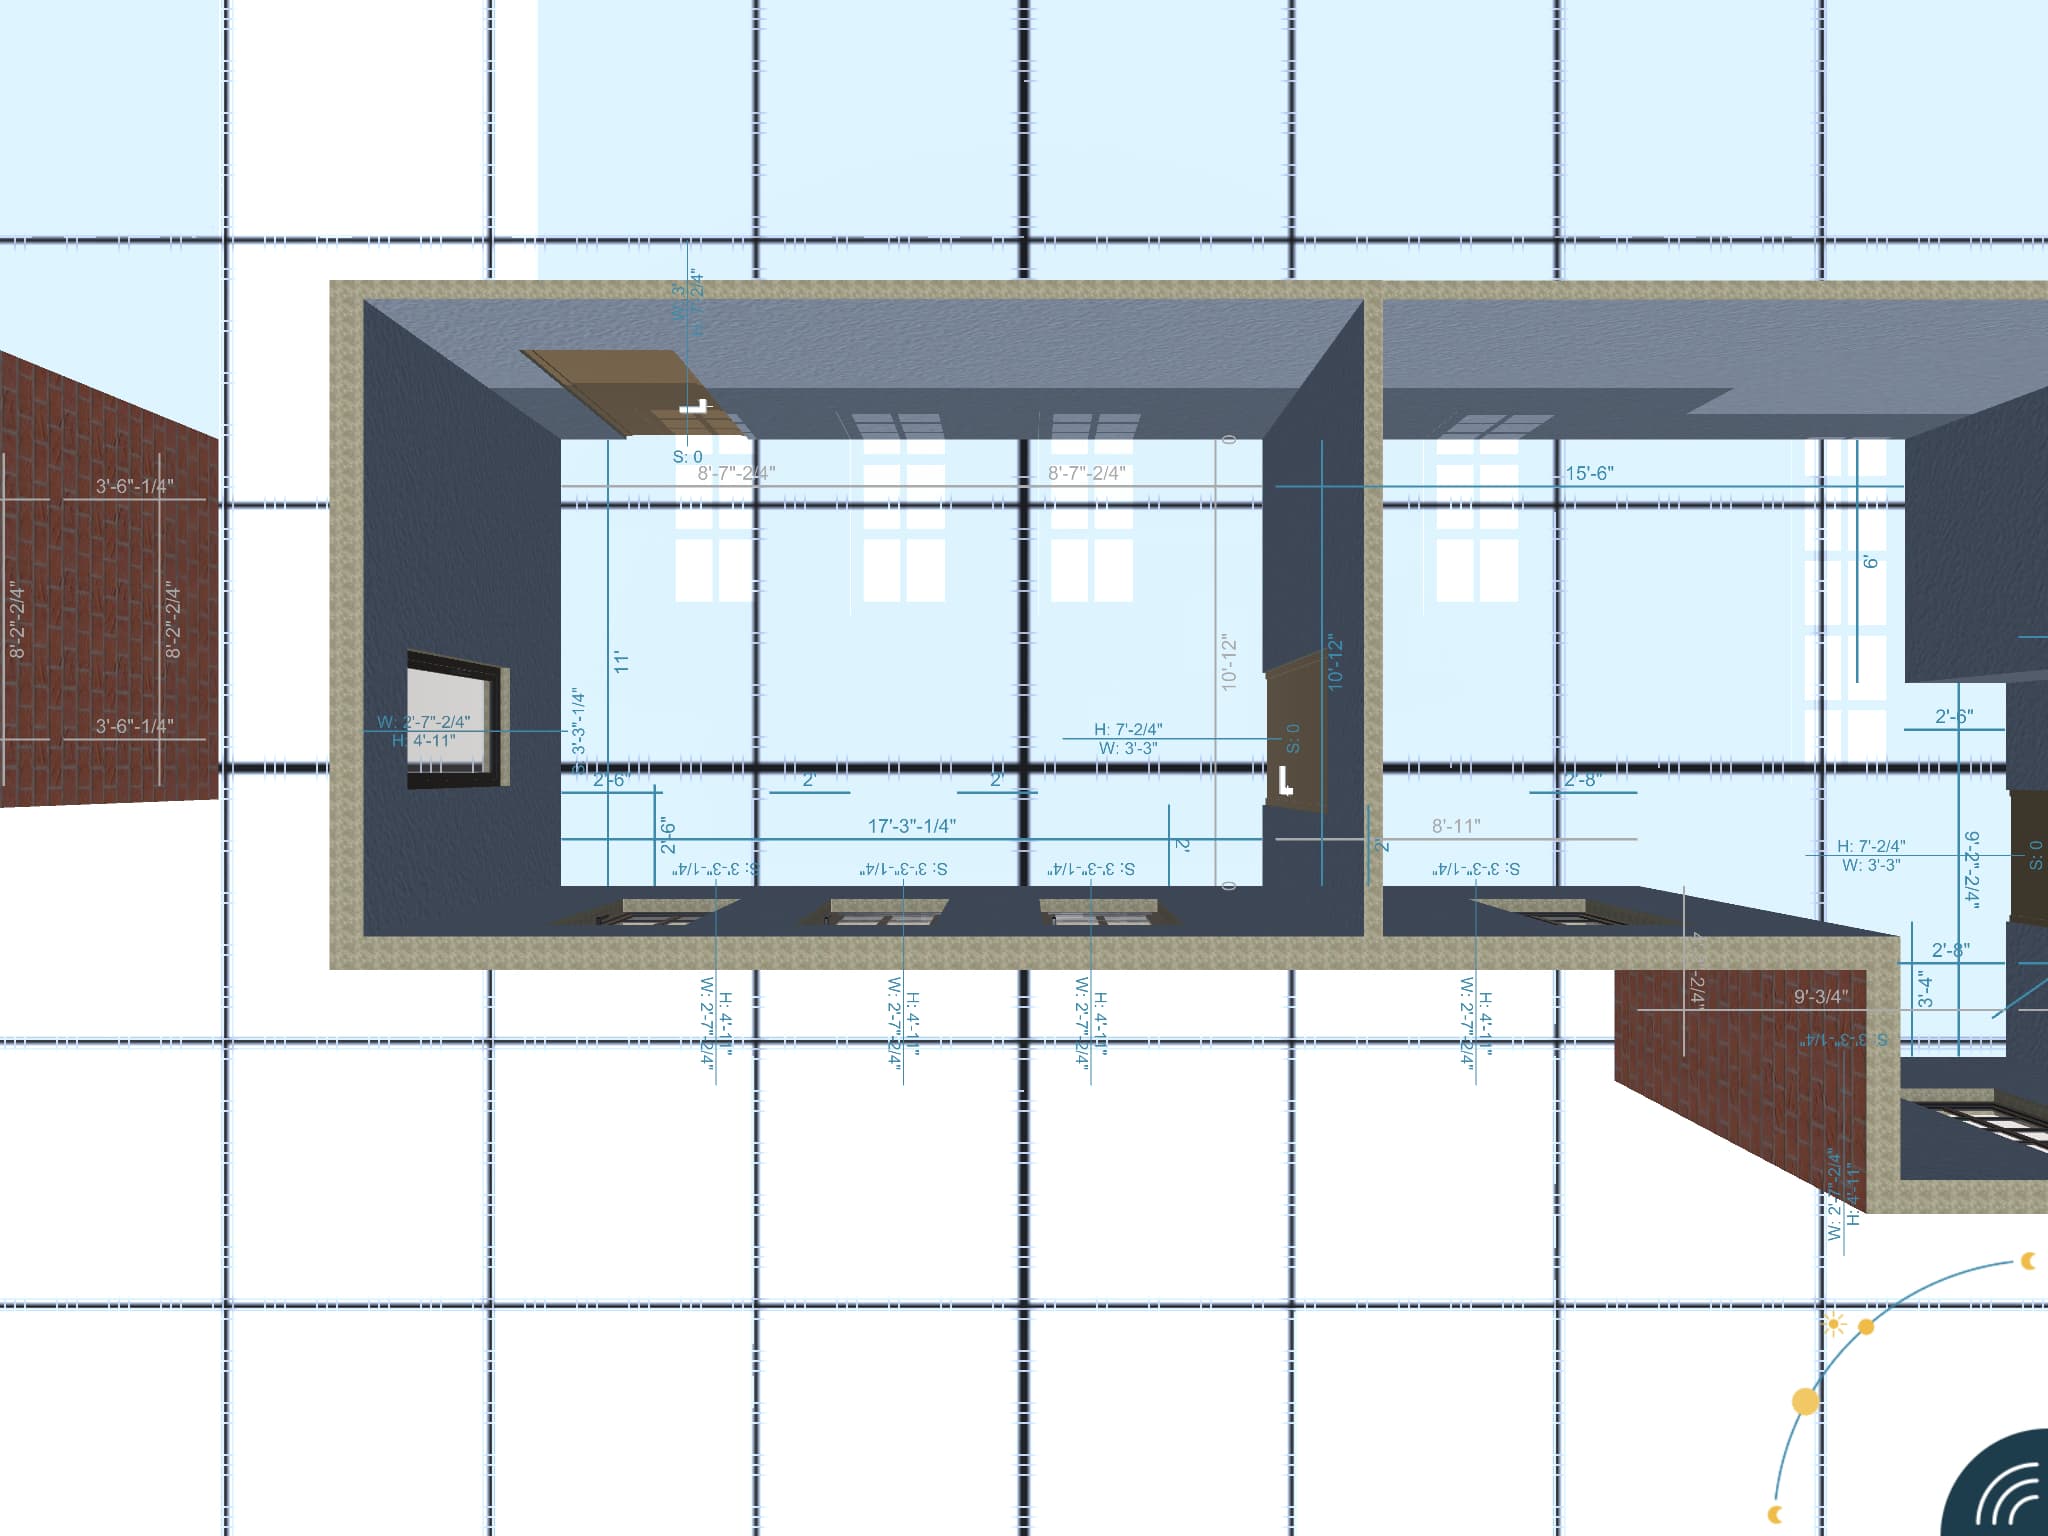
Before we take a look at what the IFC file looks like in Solibri Model Checker, we should cover what the survey model data looks like now. To do that we select the Tools palette again in the lower right corner. Then tap the “3D” button. Depending on the default secondary mode buttons selected, the model may look like this—straight down on the 3D from the sky. (see image 23)
23 – In 3D model the user has optional sub-modes for viewing their surveyed buildings in 3D, including flyby and walkthrough modes.
An orbital button, 4th selection up from the lower left, transforms into a 3D perspective mode. Tapping the helicopter icon button moves the model further way while tapping on the walking human figure button places the camera at the ground level for a walk-through. (see image 24) During this also brings up a walkthrough controller lower left of the screen. Two other buttons control the sun’s position. (see image 25)
24 – Walk-through mode enables an “eye-level” view of the surveyed building.
25 – Another option in 3D is locating the sun position and angle in the sky.
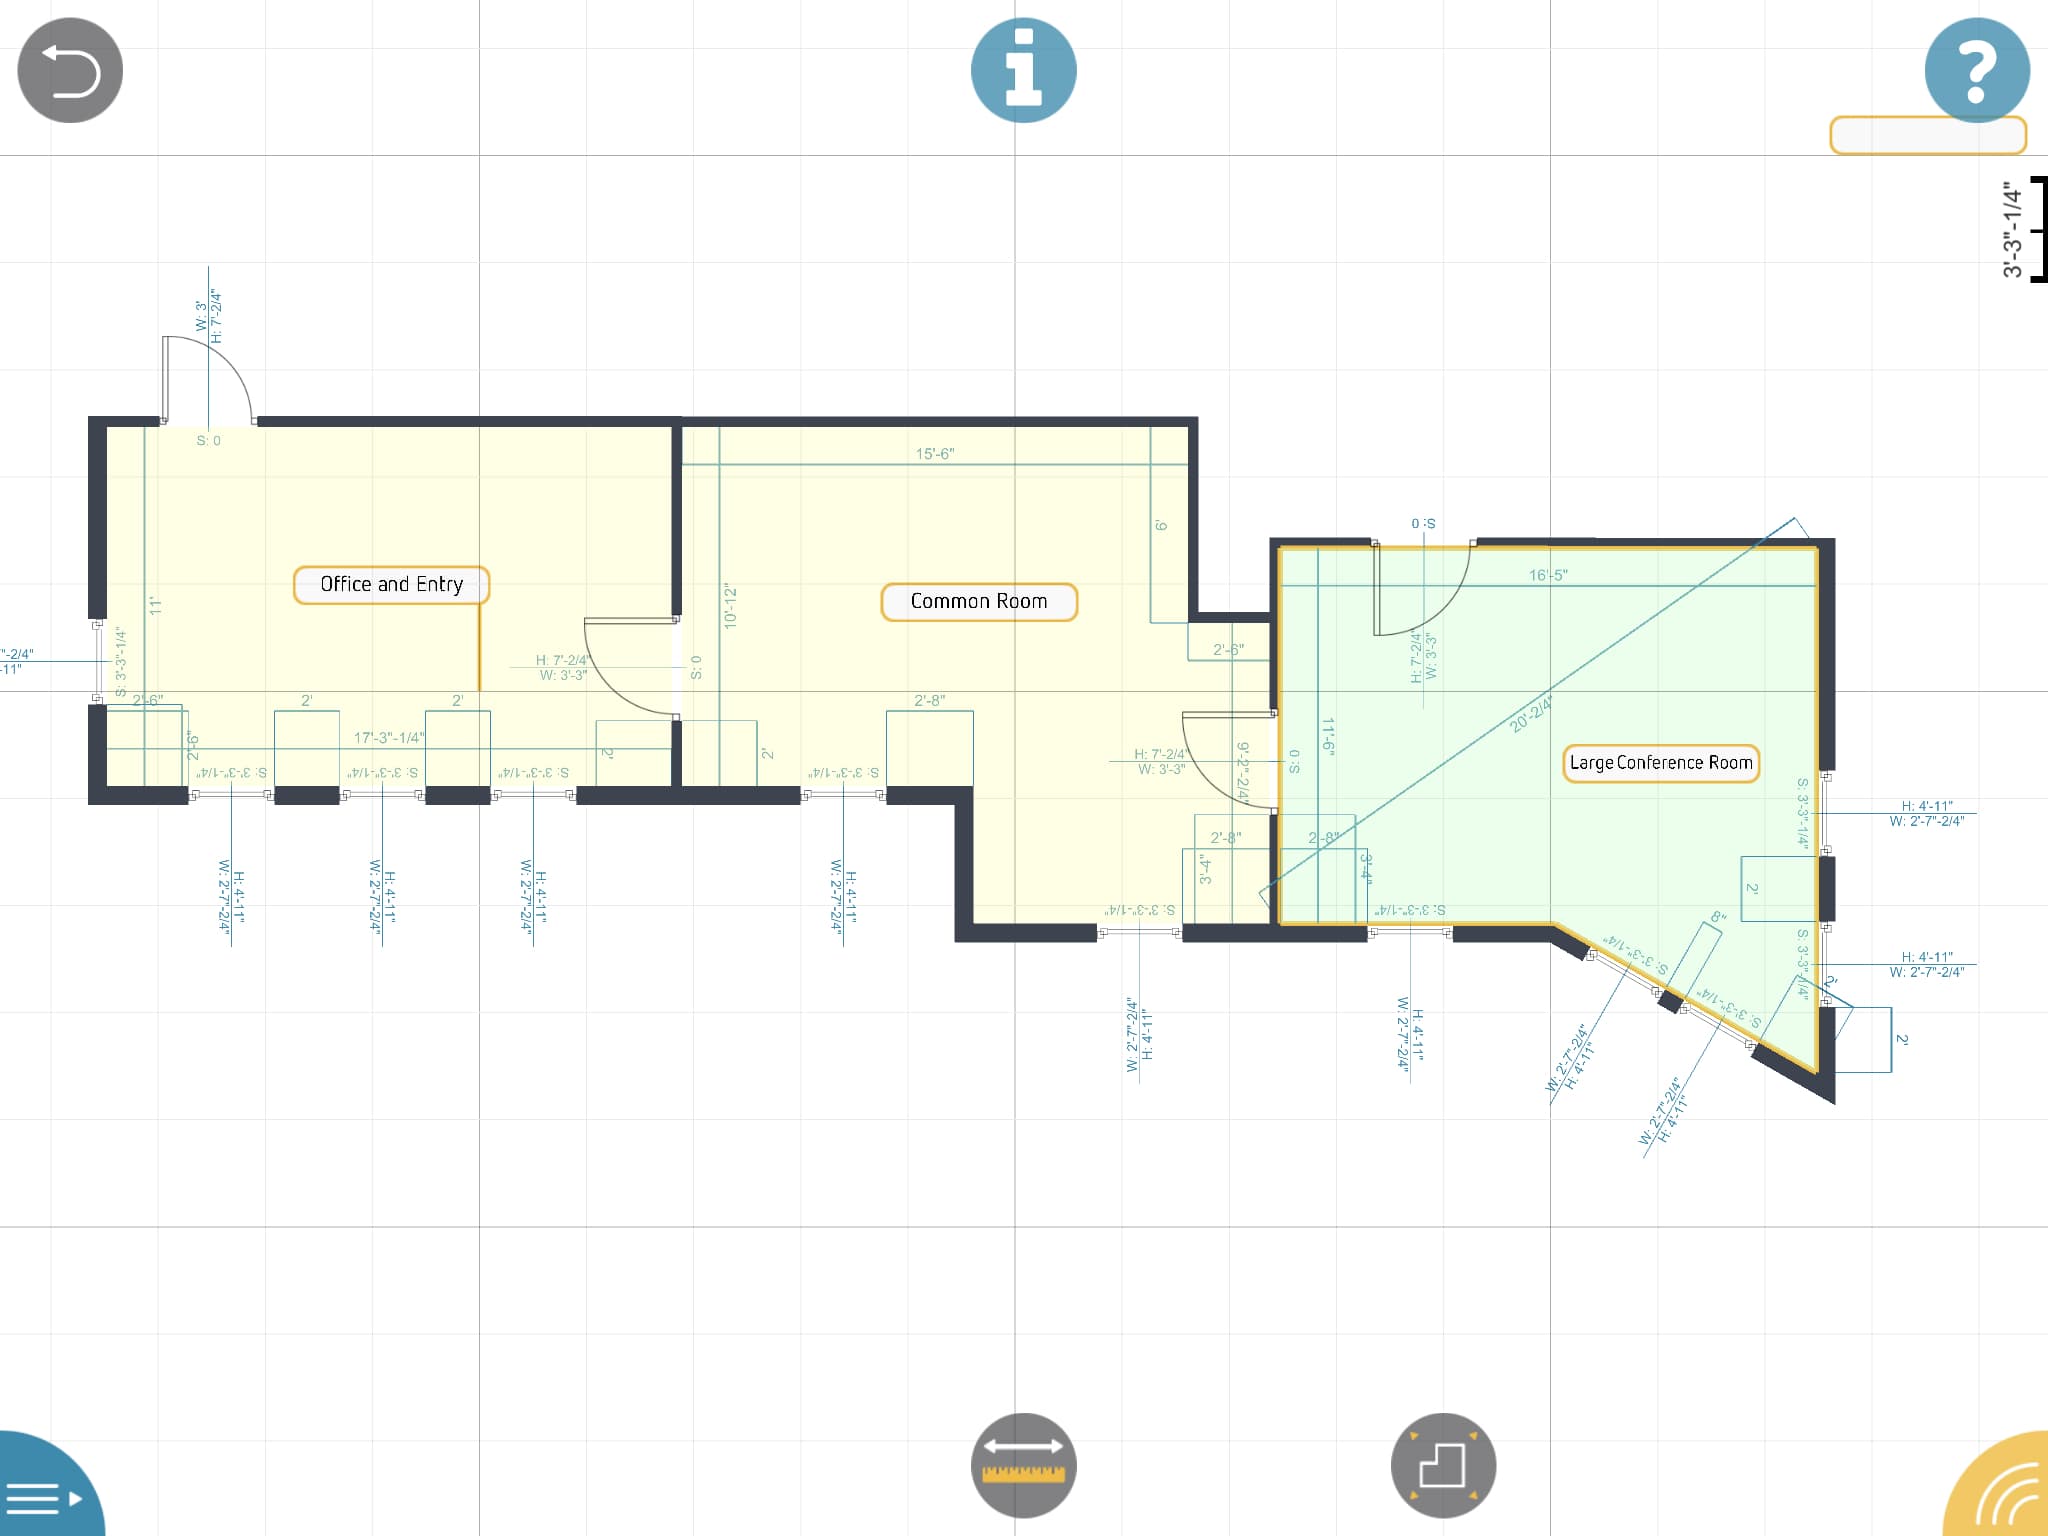
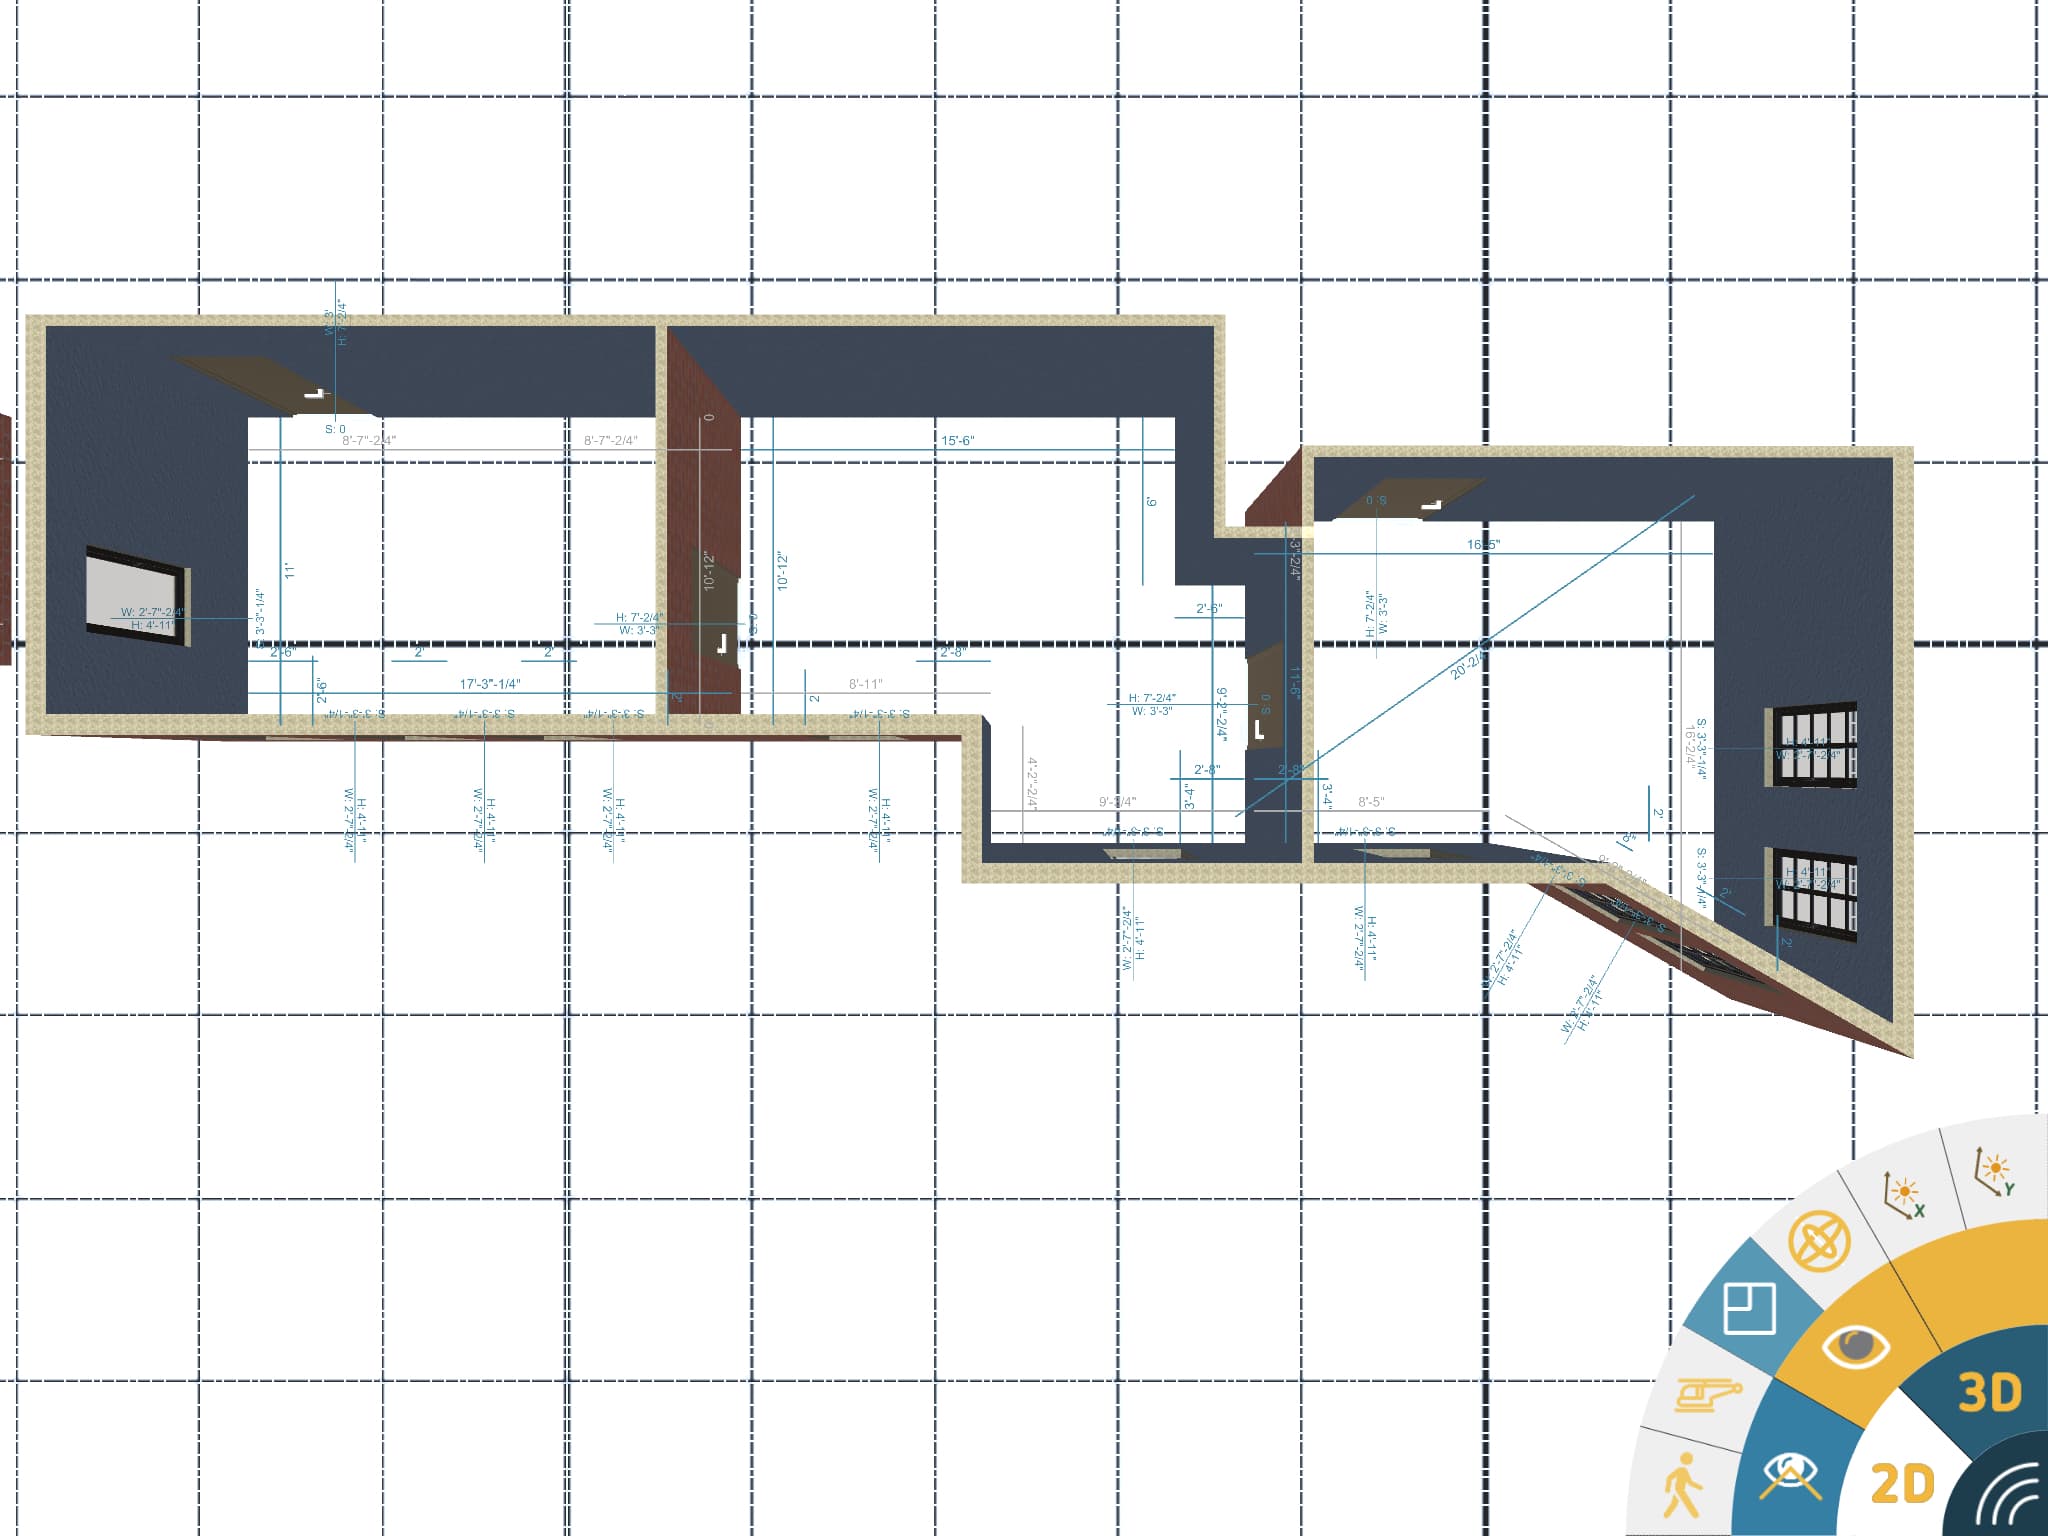
26 – The overall building surveyed with OrthoGraph I and with dimensions, room titles and dimensions visible.
One last thing before we check the model in Solibri. It is possible to view the surveyed plan and building model with dimensions shown (see image 26 – 27). Notice the two lower icons showing dimensions. They both show different levels of measurement data, one in particular, showing the width and height dimensions for doors and windows.
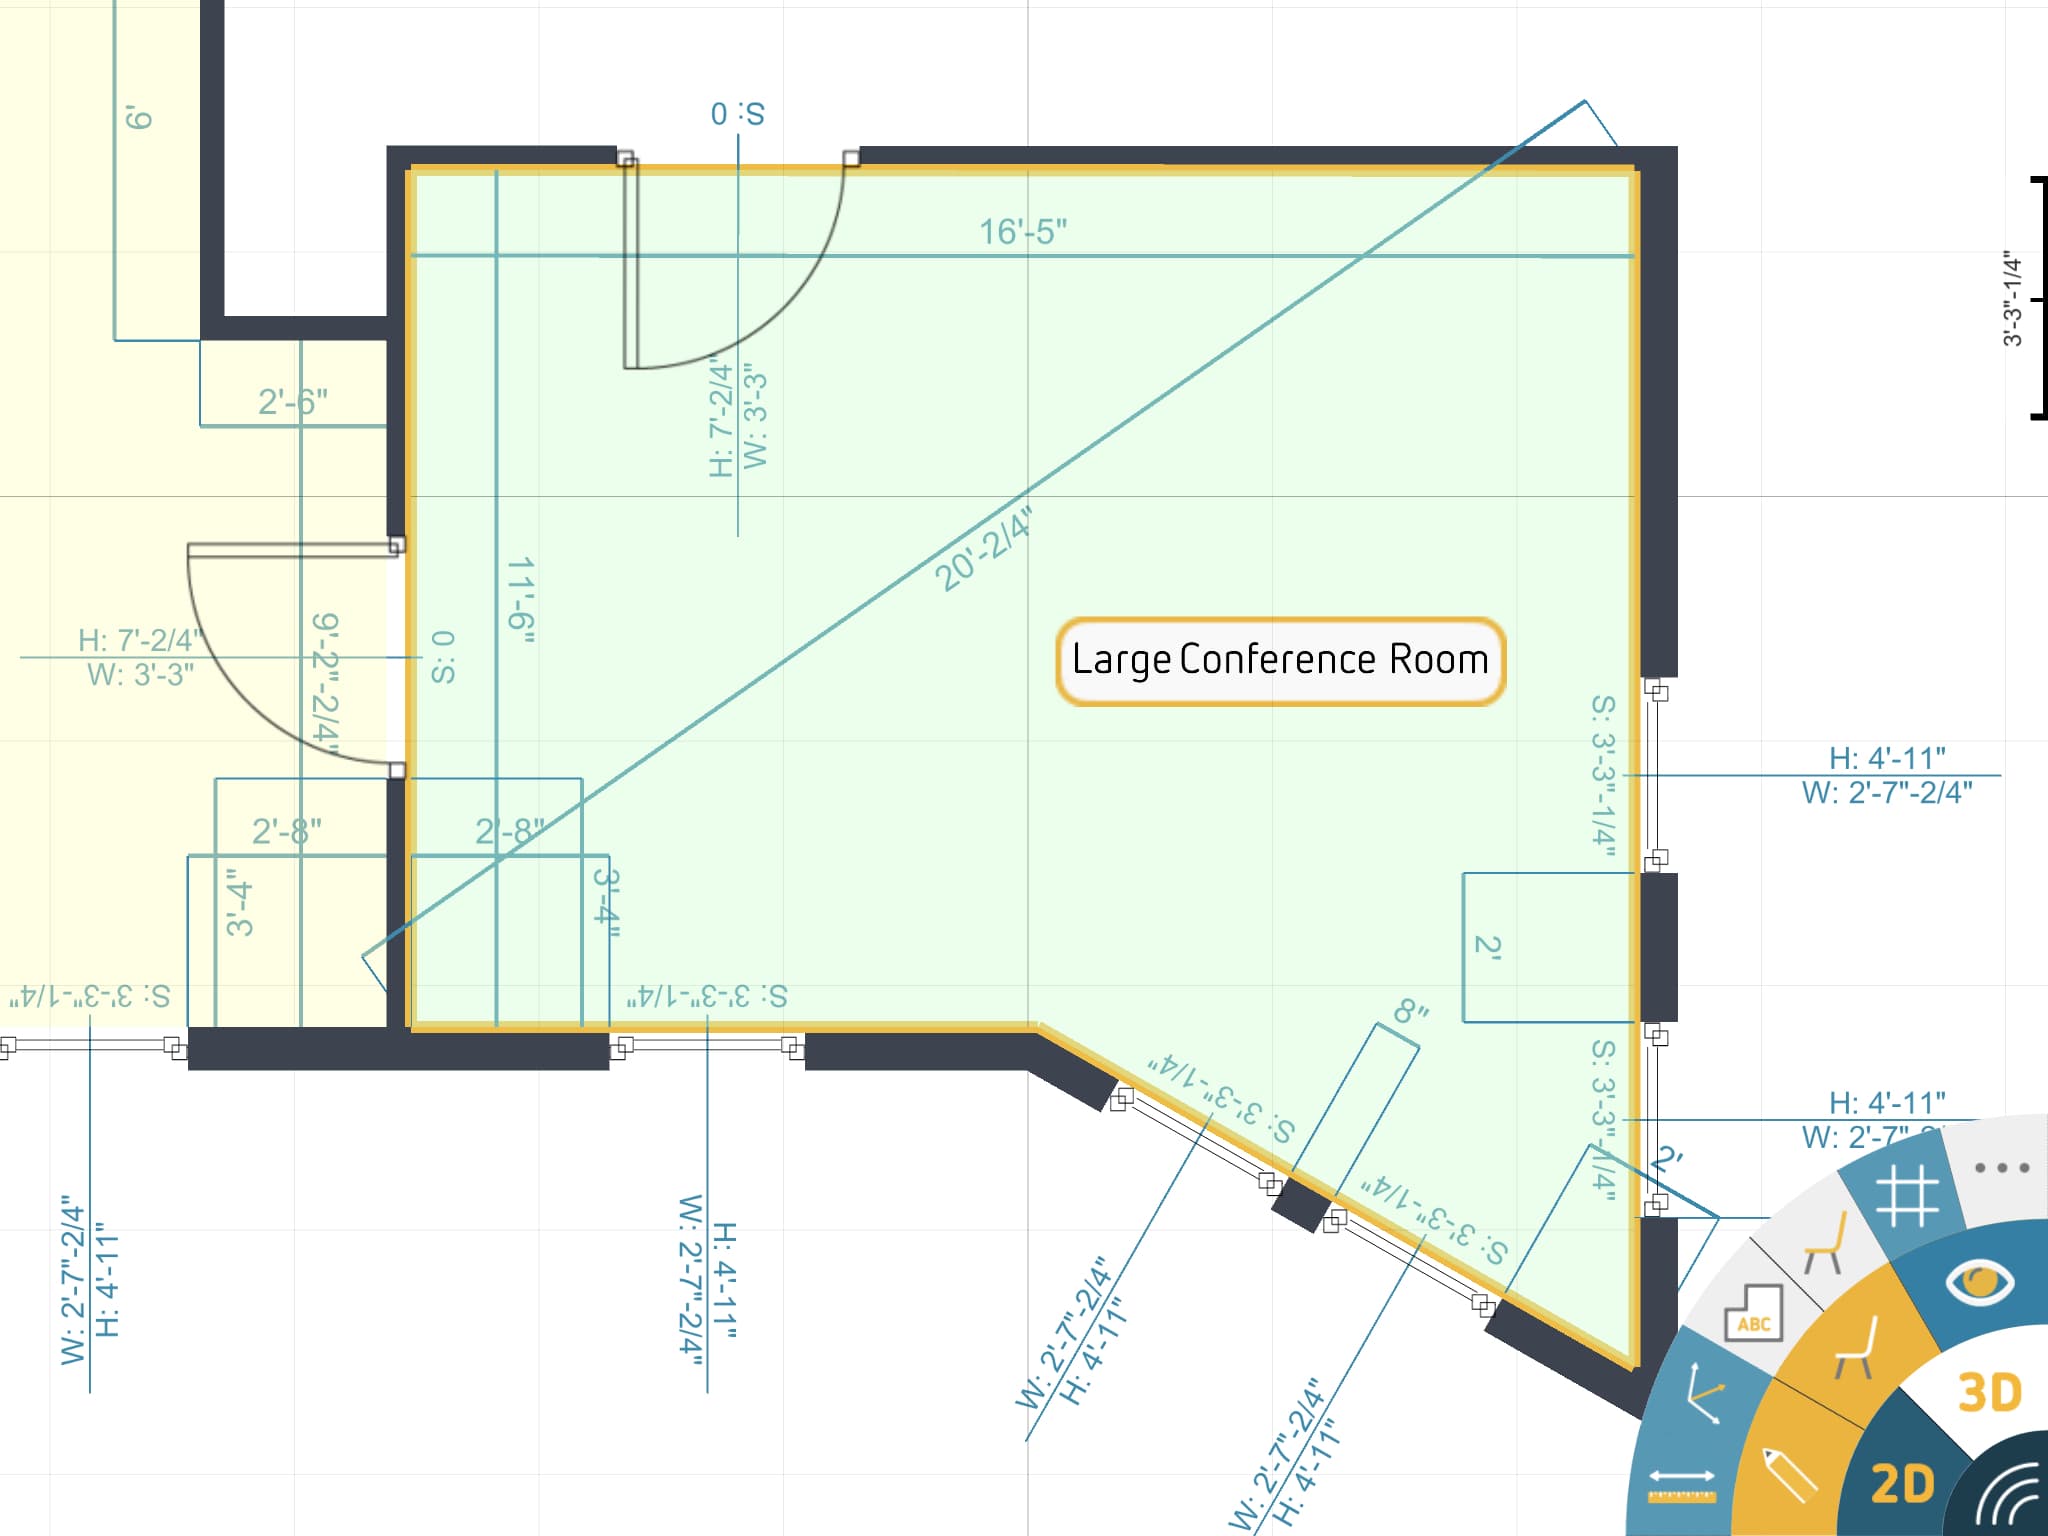
27 – Zooming into the final product. Note the colors, title, dimensions and data around openings, etc.
When you export out of OrthoGraph I the app sends data via an email attachment. In the case of the IFC export, I saved the IFC files to my desktop and then opened it in Solibri Model Checker (seen in image 28) but you can open such a file in any 3D, CAD or BIM app that works with the industry standard BIM format (IFC).

28 – OrthoGraph I output in IFC viewable in Solibri Model Checker. OrthoGraph I is a survey app system that can take you from field survey work to BIM model file.
One final thing to say about the Solibri IFC check. I did a quick check and added properties to objects like windows and doors, wondering if I could get that data to show up in Solibri. I couldn’t get the data to appear in Solibri, but perhaps the failure is more my doing and lack of knowledge of working with IFC data.
Adding Furniture and Other Items
Although I did not explore or cover this topic much in my review, OrthoGraph I does have the ability to locate furniture and objects in the plan. These include three-dimensional objects and furniture, so your chairs, tables and lamps appear in the BIM model data. Object data includes things like boilers, plumbing, tanks, electrical outlets and generally all the things you find in buildings beyond furniture.
Closing Comments & Recommendations
This extensive review has been semi-structured like a “How-To” article. I chose to do this because both from my own experience learning the app and from some feedback from Architosh readers who wrote in saying they tried the app earlier in its existence, I felt some tips and instruction were in order.
Although many pros are used to iOS and Android apps every day, and hence use to multi-touch, using a tool as sophisticated as OrthoGraph I presents an interesting first-user problem. Because the app operates fundamentally and looks like a desktop CAD or 3D tool, the UX (user-experience) pros have acquired from the desktop can often lead them into some minor confusion. The net result is that OrthoGraph I can seem harder than it really is to some.
Advertisement
What is really required for success is experience with a multi-touch based app with both complexity and CAD-like operations. Only time solves that. That doesn’t mean this app is flawless. There are several areas for improvement.
The user-interface, in general, is brilliantly conceived. The fan wheel type Toolbar is incredibly smart. Several multi-touch trouble spots involved how to “de-select” items once you have changed your mind. I never could figure this out. The undo/redo arrow buttons also take time to understand what they back you up from and what they don’t. When the user launches the app for the first time, it begins an introductory tutorial app—which is quite cool! I wanted to revisit this tutorial app many times during the learning process but this too I could not figure out. From the main window or the “Main menu” area, the only help-like button has a question mark and it actually brings up your email program to report a problem, not offer answers to questions. The only assistance in the app seems to be in the tool tips that appear, and they are indeed helpful.
Despite some of the challenges in learning and mastering the application, OrthoGraph I is a godsend to AEC pro trying to speed up the survey building process. When you know this app well you can zip through field measurement work—especially using a laser distance meter. And the best part is the instant export to CAD or BIM formats. IFC means you can send your model data directly into your BIM application.
And in a future release, you will be able to share your BIM models and CAD files from the OrthoGraph Cloud. To share CAD and BIM files now the app emails them out and I tested this thoroughly and it worked very well.
OrthoGraph I has various licensing options, from quarterly, semi-year, and annual yearly licenses, to a monthly or weekly ticket. Prices range from $14.99.USD to $399.99.USD. And the company also sells “business” class licenses for larger firms.
Overall, OrthoGraph I is a true and useful iOS app for AEC professionals and I can hardly imagine going back to paper and tape measure now after testing this app so thoroughly for several weeks. Depending on one’s requirements for doing building survey work, and frequency of such work, all AEC pros should consider evaluating OrthoGraph I. The time saved inputting data from pen and pad into a CAD/BIM solution alone pays for the investment. —- ANTHONY FRAUSTO-ROBLEDO, AIA, LEED AP
Pros: OrthoGraph I has a matured and elegant user-interface that logically and deftly handles complexity in CAD drawing using multi-touch and your finger or a stylus like the Apple Pencil; smartly utilizes corner-positioned, pop-up fan wheel style toolbar maximizing screen real estate and making it possible to work on a smartphone; app smartly produces straight lines and closes room shapes from free-hand sketches of rooms. OrthoGraph I also features a robust library of objects from doors, windows, furniture, lights, and various mechanical systems and devices common to buildings. OrthoGraph I enables capable CAD, PDF, Excel and BIM (IFC) export directly from the app, greatly streamlining workloads and saving AEC and related pros tremendous costs; app works brilliantly with laser distance meters (LDMs) like Leica Disto D2, et al.
Cons: OrthoGraph I takes practice to master despite introduction tutorial built into the app; the Help button doesn’t answer questions but opens up your email for direct communication to tech support; users would benefit from more robust video tutorials addressing common pitfalls in early use. OrthoGraph I doesn’t an on-board help system or point out to URLs with help.
Advice: The app can be easy-to-hard for users to learn depending on their experience using sophisticated iOS or Android but is deeply rewarding once mastered. When paired with a laser distance meter like the Leica Disto D2 device I used, you will never want to do interior building survey dimensions the old way ever again. This app is highly recommended for AEC pros who do building survey work quite frequently or just want to take it to an all-digital workflow.
Cost: Prices range from $14.99 – 399.99.USD depending on license subscription time-frame and there are business class license offerings available as well.
![]()

SaveSave
SaveSave