Introduction
It has been since August of 2014 that we last published a review of SketchUp and in that version (SketchUp 2014) the big news was the support of Industry Foundation Classes (IFC) file format in the world’s most popular 3D modeler. Since that time a lot has taken place in the world of SketchUp. For starters, while IFC export was new in SketchUp 2014 when we reviewed it that year, somewhere along the way IFC import was also supported. (We’ll mention more notes on BIM and SketchUp toward the ends of the review).
Also new since our last review six years ago, Trimble acquired Sefaira, the popular energy analysis software that works with BIM tools and SketchUp models. These tools are now included in what is known as SketchUp Studio, Trimble’s flagship version of the software. SketchUp Pro is still the most popular version of the software used in AEC workflows, while SketchUp Free and SketchUp Shop are versions for personal use.
Ecosystem vs Modeler
We noted in our 2014 review that there really weren’t any major new modeling functionalities added to SketchUp compared to prior versions. Trimble’s development efforts over the years have largely been focused on other areas; in some regard, SketchUp as a modeler is fully matured for what the company wants in its core capabilities. In other words, the assumption is that Trimble is letting third parties tackle more advanced features in modeling powers. When I asked Hariharan Natarajan, Customer Success Manager, Trimble, if this assumption was correct he confirmed by saying that “there are lots of specialties and types of users of SketchUp and they all have unique needs.”
And in mentioning the vast ecosystem known as Extension Warehouse, he says, “So we have created a platform that SketchUp users can plug into and just self-serve,” meaning that what users get today with SketchUp is a powerful and popular 3D modeler where they can direct their attention to thousands of extensions written by third-parties to tailor SketchUp to their specific purposes.
Insofar as architects are concerned, or even AEC users at large, that subject of Ecosystem versus Modeler is one Architosh will have to in full force in another article. Our primary goal with this review is to review SketchUp Studio, which encapsulates SketchUp Pro and Sefaira and to partly introduce the reader to Sefaira’s energy and daylight analysis features.
But first, let’s review the new in SketchUp 2020.
New in SketchUp 2020
Tags Not Layers
The big new change in version 2020 of SketchUp is that layers are now renamed as “tags.” One might think that renaming something is hardly much of a change, but in truth, there is much more to this adjustment. Let’s talk about why this is.
“Layers” was always the wrong word in SketchUp. In other 3D, CAD, and BIM software programs, the use of “layers” tends to mean more than just controlling visibility. Layers tend to represent the structure, order, and the protection and visibility of objects. The way you protect, structure, and organize objects in SketchUp is through groups and components, in addition to layers, now named tags.
The improved Outliner palette dovetails with Trimble’s decision to call rename the Layers palette Tags and encourages users to use the Outliner for structuring their model by groups and components. Now it is not necessary to use hundreds of formerly called “layers” to structure your SketchUp model.
Moreover, an important new feature in Layers 2020 is the ability to control the visibility of objects by tag from the Tags control palette. Speaking of palettes, in Layout 2020, they have been updated; users now can control various aspects of viewports without affecting other viewports.
In version 2020, the formerly called Layers palette is only renamed (to Tags) and other aspects largely remain the same. Still, Trimble wants users to now organize and provide structure for their models not by having zillions of layers but by using the Tags palette in conjunction with updates to the Outliner palette.
Outliner
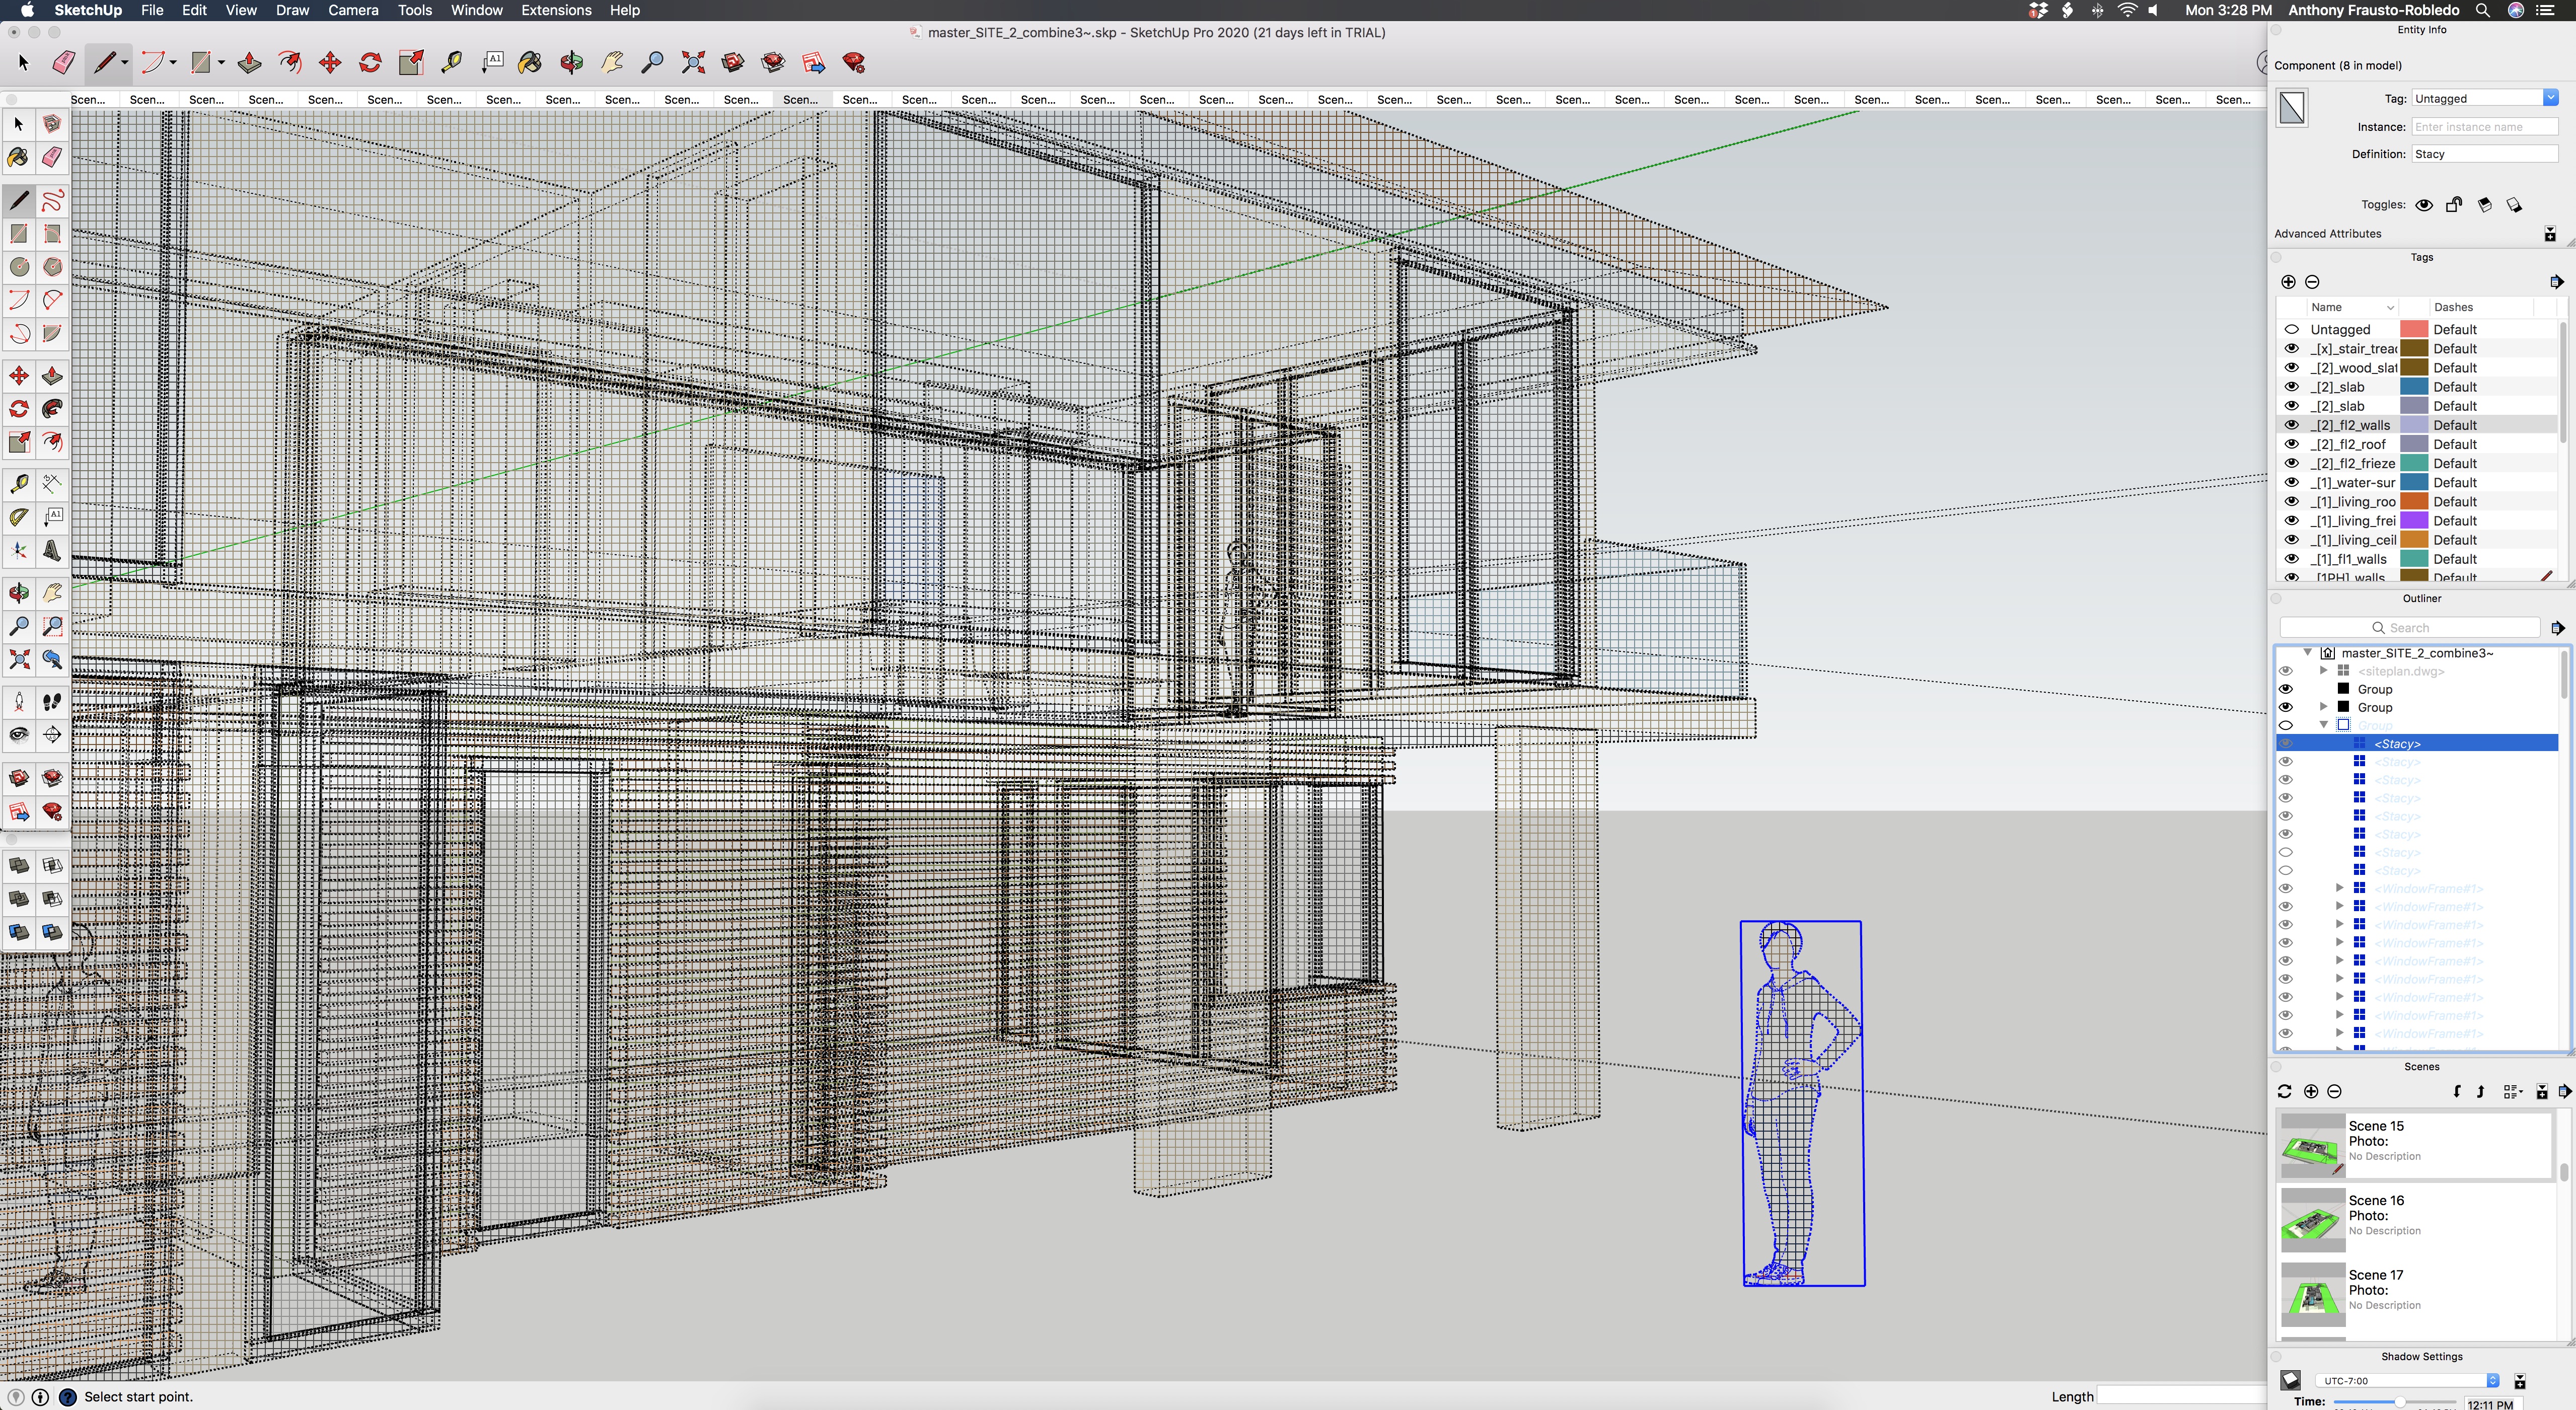
Outliner now features small but significant changes. A new eyeball icon enables the user to control the visibilities of groups and components in your model. In this way, Outliner works similarly to many other professional 3D modeling, rendering, and animation tools. A model in SketchUp can consist of nested groups within groups. But with the new Outliner, the user has visibility control of these hierarchies.
These “groups” and “components” in Outliner can be renamed—and it is advised that you do. By naming groups and components in Outliner, you can now tap the power of the search tool to filter for specific items in your model. A single click on the word “Group” in the Outliner should give you that field in blank-form so you can rename it.

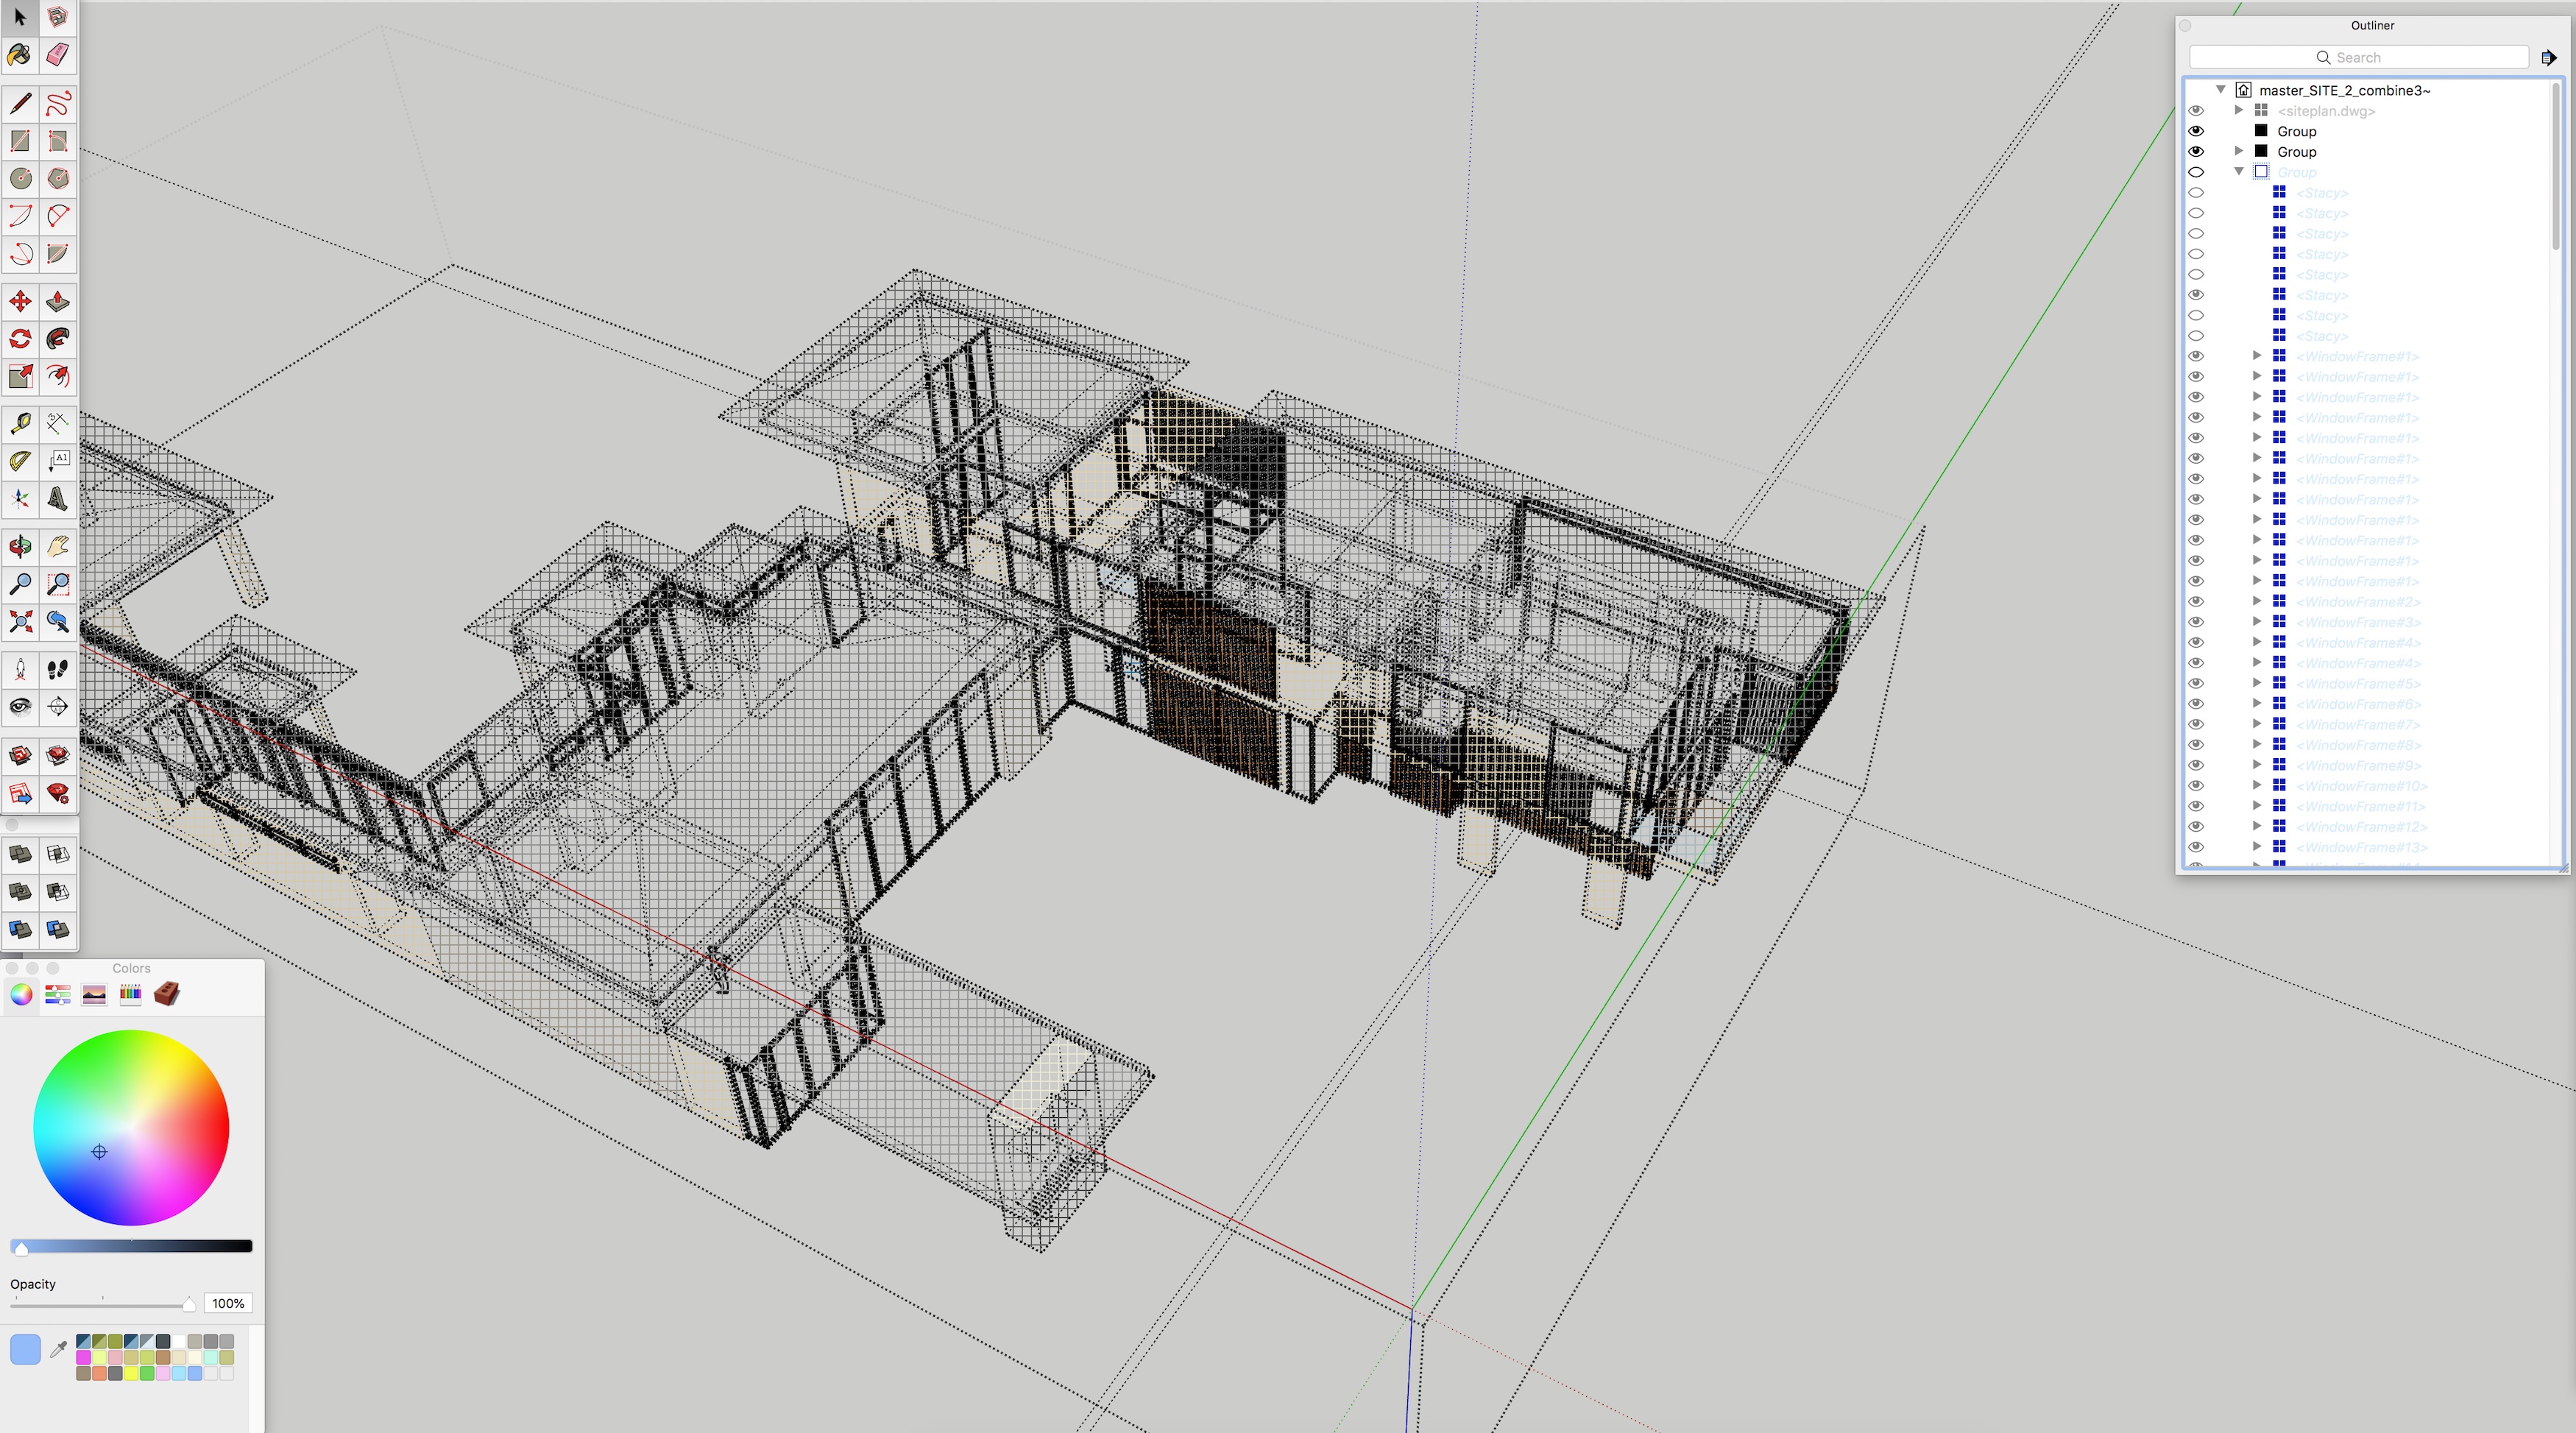
In this image, I have isolated all things in the Outliner that match the search term “slats” including groups name as such inside of the “unnamed” group.
For example, I was able to name wood shading devices on this model “Wood Slats” and searching by slats helped me isolate these objects in the model. One thing I did discover however is that when you search (filter) by a word or name, only those groups or sub-groups with that naming match will appear. This can be detrimental in some instances. For the wood slat shading devices, I created in this modern house (see the image above and below), naming every single piece or board can be time-consuming and also disruptive to your workflow. But what if I want to show what that shading panel looks like with every other board not there? That’s where the problem comes in. If I search the Outliner for “slats” it finds all the wood slat groups in the model but doesn’t let me see into groups nested in these main groups because they are not named and thus cannot match “slats” in the search field.
Sometimes this default control is good; in this case, it is bad. It robs me of the new power of the Outliner. A simple toggle button named “View Sub-Groups” in the Outliner would let me turn off and on the ability to see what is nested inside a group without having to have an exact match in the Outliner’s search field. It is impractical to assume or to make users name every single group nested inside other groups.
And finally, speaking of naming. If I have named groups “slats” I can find them with the letters “slat.” I don’t have to have all the letters match exactly. This is another interesting control level that Trimble might put into the hands of users—exact match versus partial match.
Inside the improved Outliner, the user can not only control the visibility of each group or component but can also control such visibility of nested groups, individually adjusting visibility by sub-item. Additionally, double-clicking on a group or component name while the eyeball icon is unselected will “ghost” the objects in that group or component, including all nested objects, as seen in this image.
One final important point about Outliner. When you select a tag in the Tags palette and make it invisible (previously known as making a Layer invisible) the groups and components assigned that tag do not fully disappear in the Outliner. Instead, they show up grayed out but selectable.
Other Items and Layout
There are other minor improvements in the basic functionalities of SketchUp 2020 but these items are the biggest and most important features. Layout 2020’s big new feature is the changes to the Tag and Outliner palettes and the new visibility controls in Outliner in conjunction with how things get structured in models. Layout 2020 is also faster at viewing larger models and has numerous small improvements.
Now let’s look at Sefaira, our primary star feature set in SketchUp Studio 2020.
Sefaira Tools
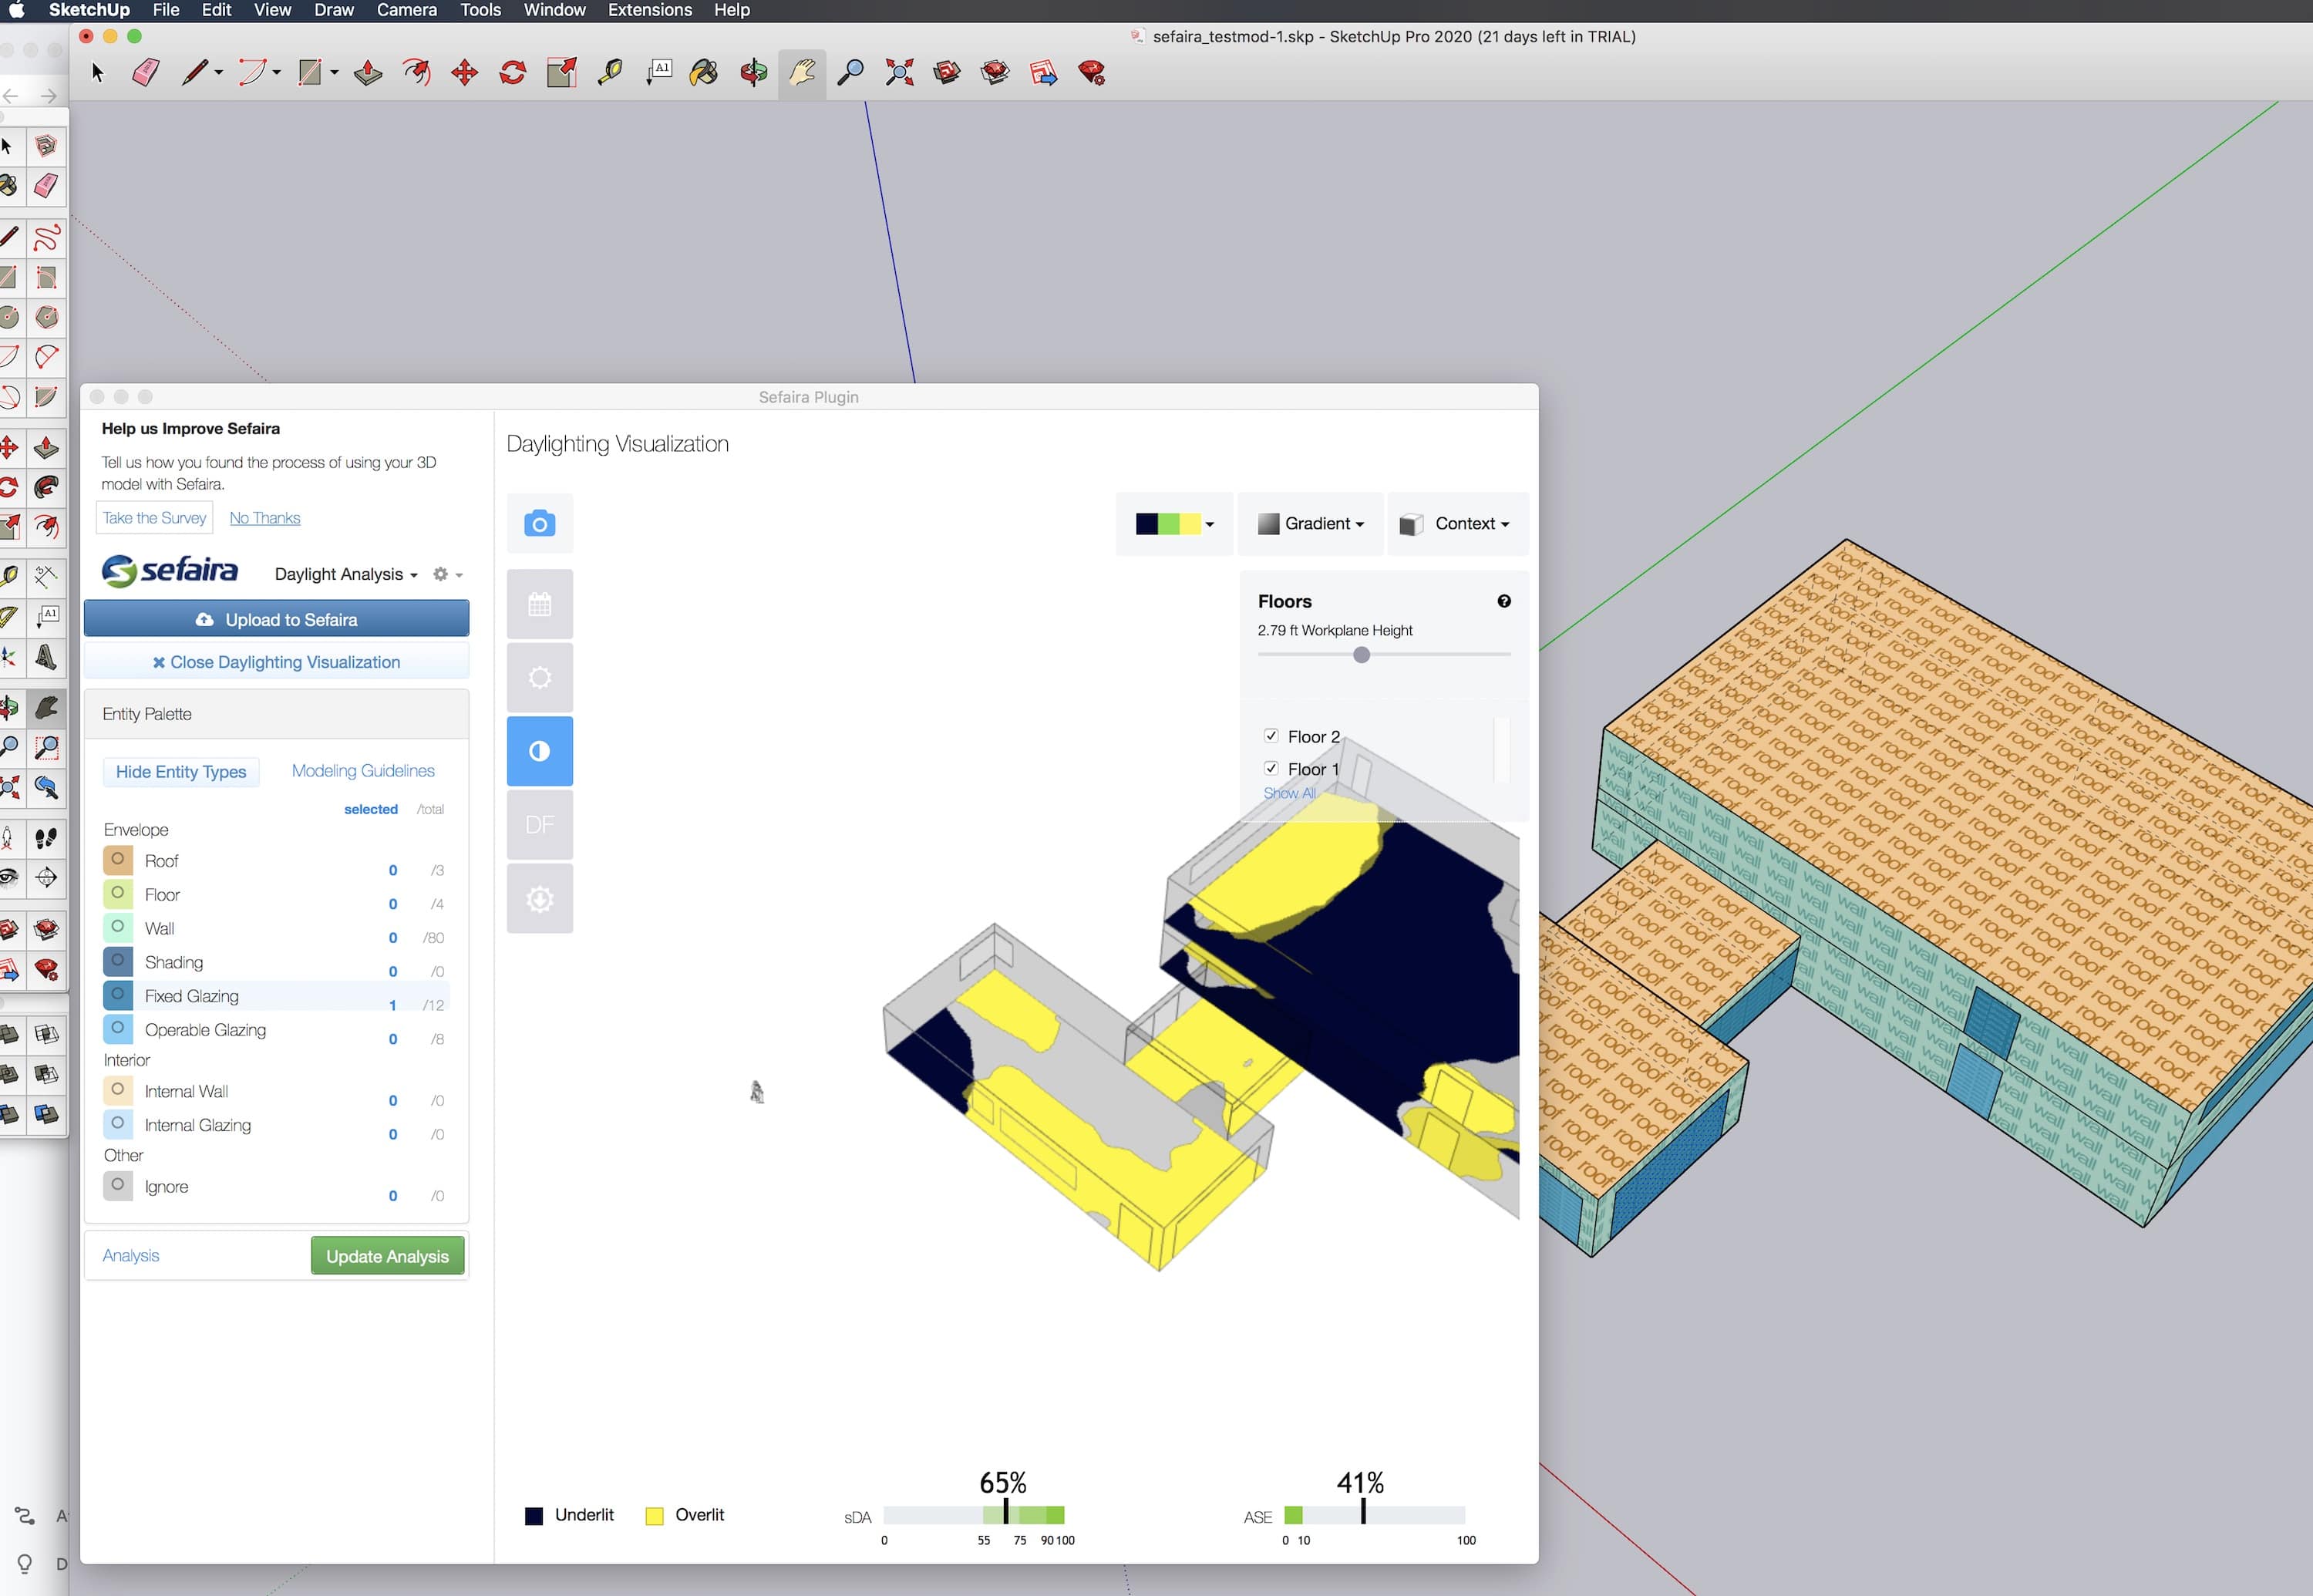
The primary benefit of SketchUp Studio 2020 over SketchUp Pro 2020 is the addition of the Sefaira energy and daylighting analysis technologies, which come into SketchUp as plugin. If you give Studio a test drive via the 30-day demo, you will notice that Sefaira is a separate download. It is technically an “extension” but you don’t get it from inside Extension Warehouse but through the Trimble SketchUp website. Your Trimble account provides you access and license control. Once downloaded, you install the extension through the Extension Manager under the menu Window > Extension Manager.
When you look at graphics of SketchUp Studio on Trimble’s website you might get the impression that Sefaira is highly integrated and part of the SketchUp Studio install, but that is not the case. It is integrated, but it is not built into the installer. As a SketchUp extension, it functions and gets installed or uninstalled just like any other SketchUp extension.
Preparing Models
For the first time user of SketchUp Studio, one might be disheartened to discover that they cannot really take a typical SU model and instantly run it through Sefaira’s energy modeling engine. That’s because a typical SU model has far too much information in it. Sefaira only needs the very basics of geometry to do its thing. It only needs “planes” for walls, glazing, roofs, and floors, for instance. The thickness of walls, for example, is not important because Sefaira assigns thermal properties to these basic geometric planes. It does not need “thickness” as a means to understand, for instance, how much batt insulation is in the wall.
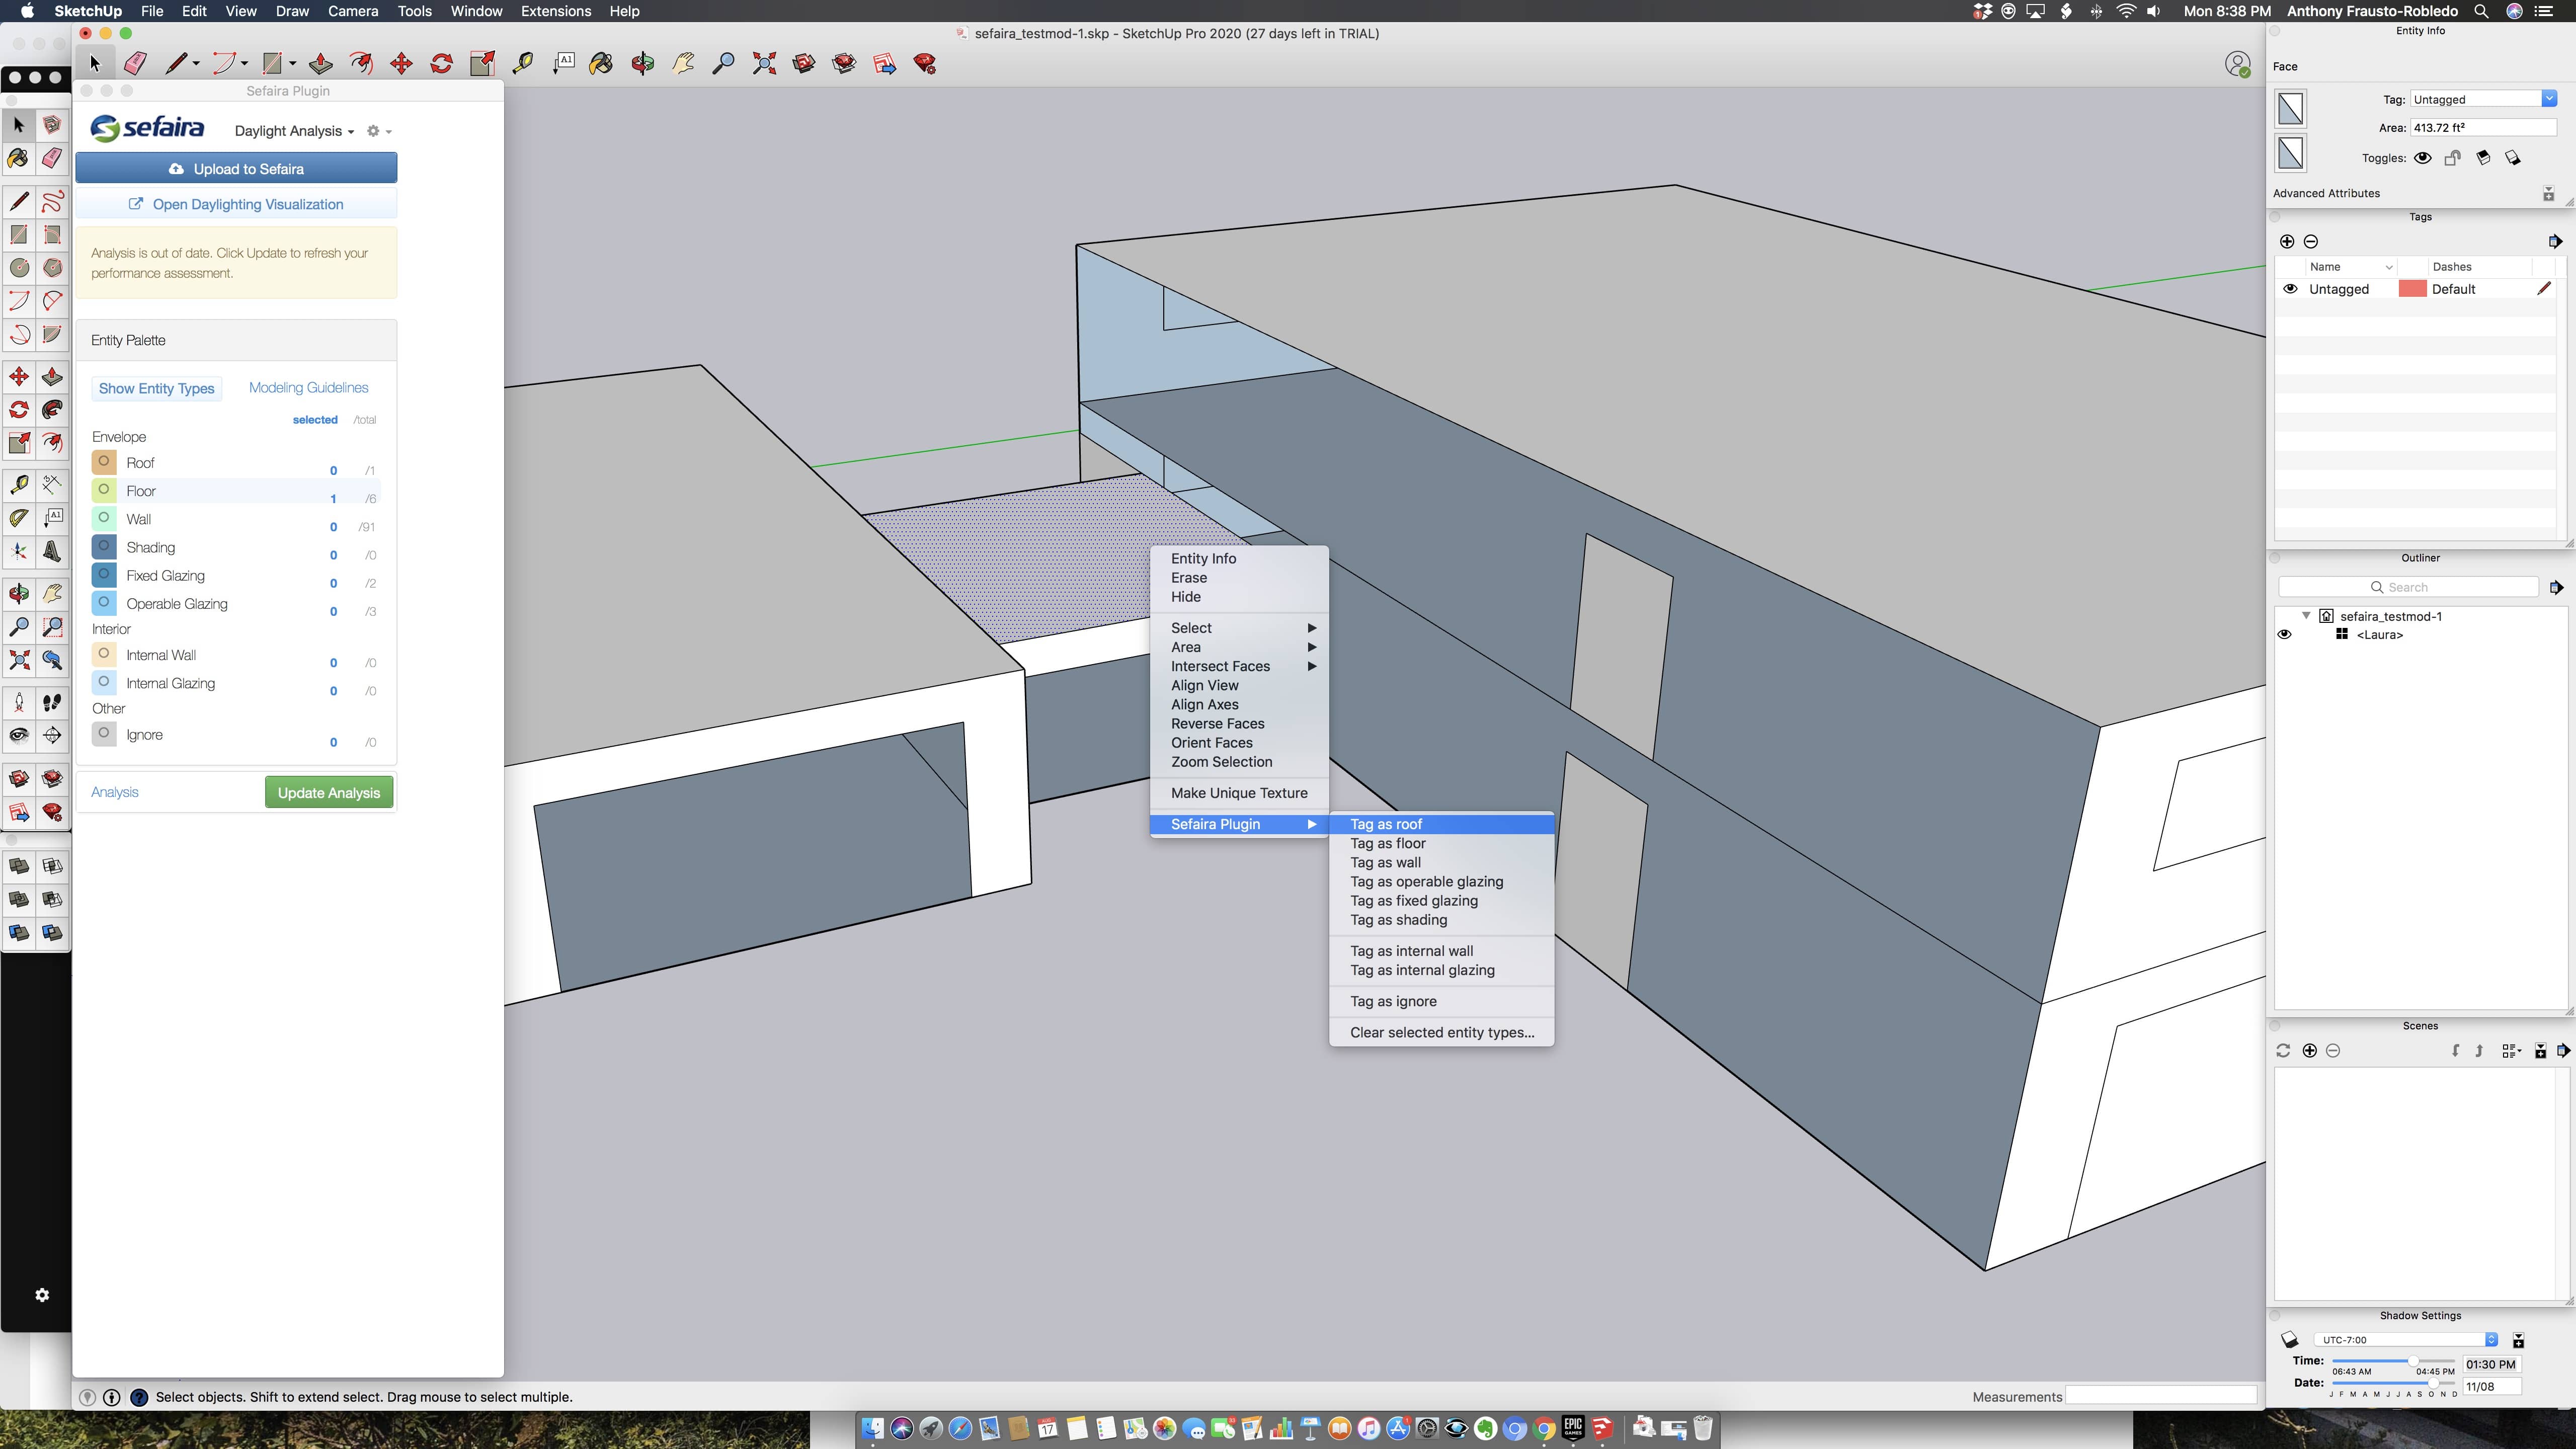
The process of taking your “virtual paper-cardboard model” and preparing it for Sefaira. You use the plugin’s context menu to classify elements in the model as roof, wall, etc.
The first task in using Sefaira is to build from scratch (recommended) or modify a design model (not recommended) to run well in Sefaira. I first looked at using a custom residence my firm designed for the Caribbean but it was a design model with loads of detail and it simply was going to be too complex for running through Sefaira’s engine. Trimble instructs that the simpler your energy model the faster your energy analysis. So follow that advice.
The Sefaira plugin palette takes a little bit of time to get used to. (see next image). At the top is the Upload to Sefaira button. Don’t hit that button just yet. The next button is Open Daylighting Visualization. It’s okay to hit that button—it expands the palette extra-wide, opening up the Daylighting Visualization window. I will get to this later. Hit the Open Daylighting Visualization button again to close that expanded window.
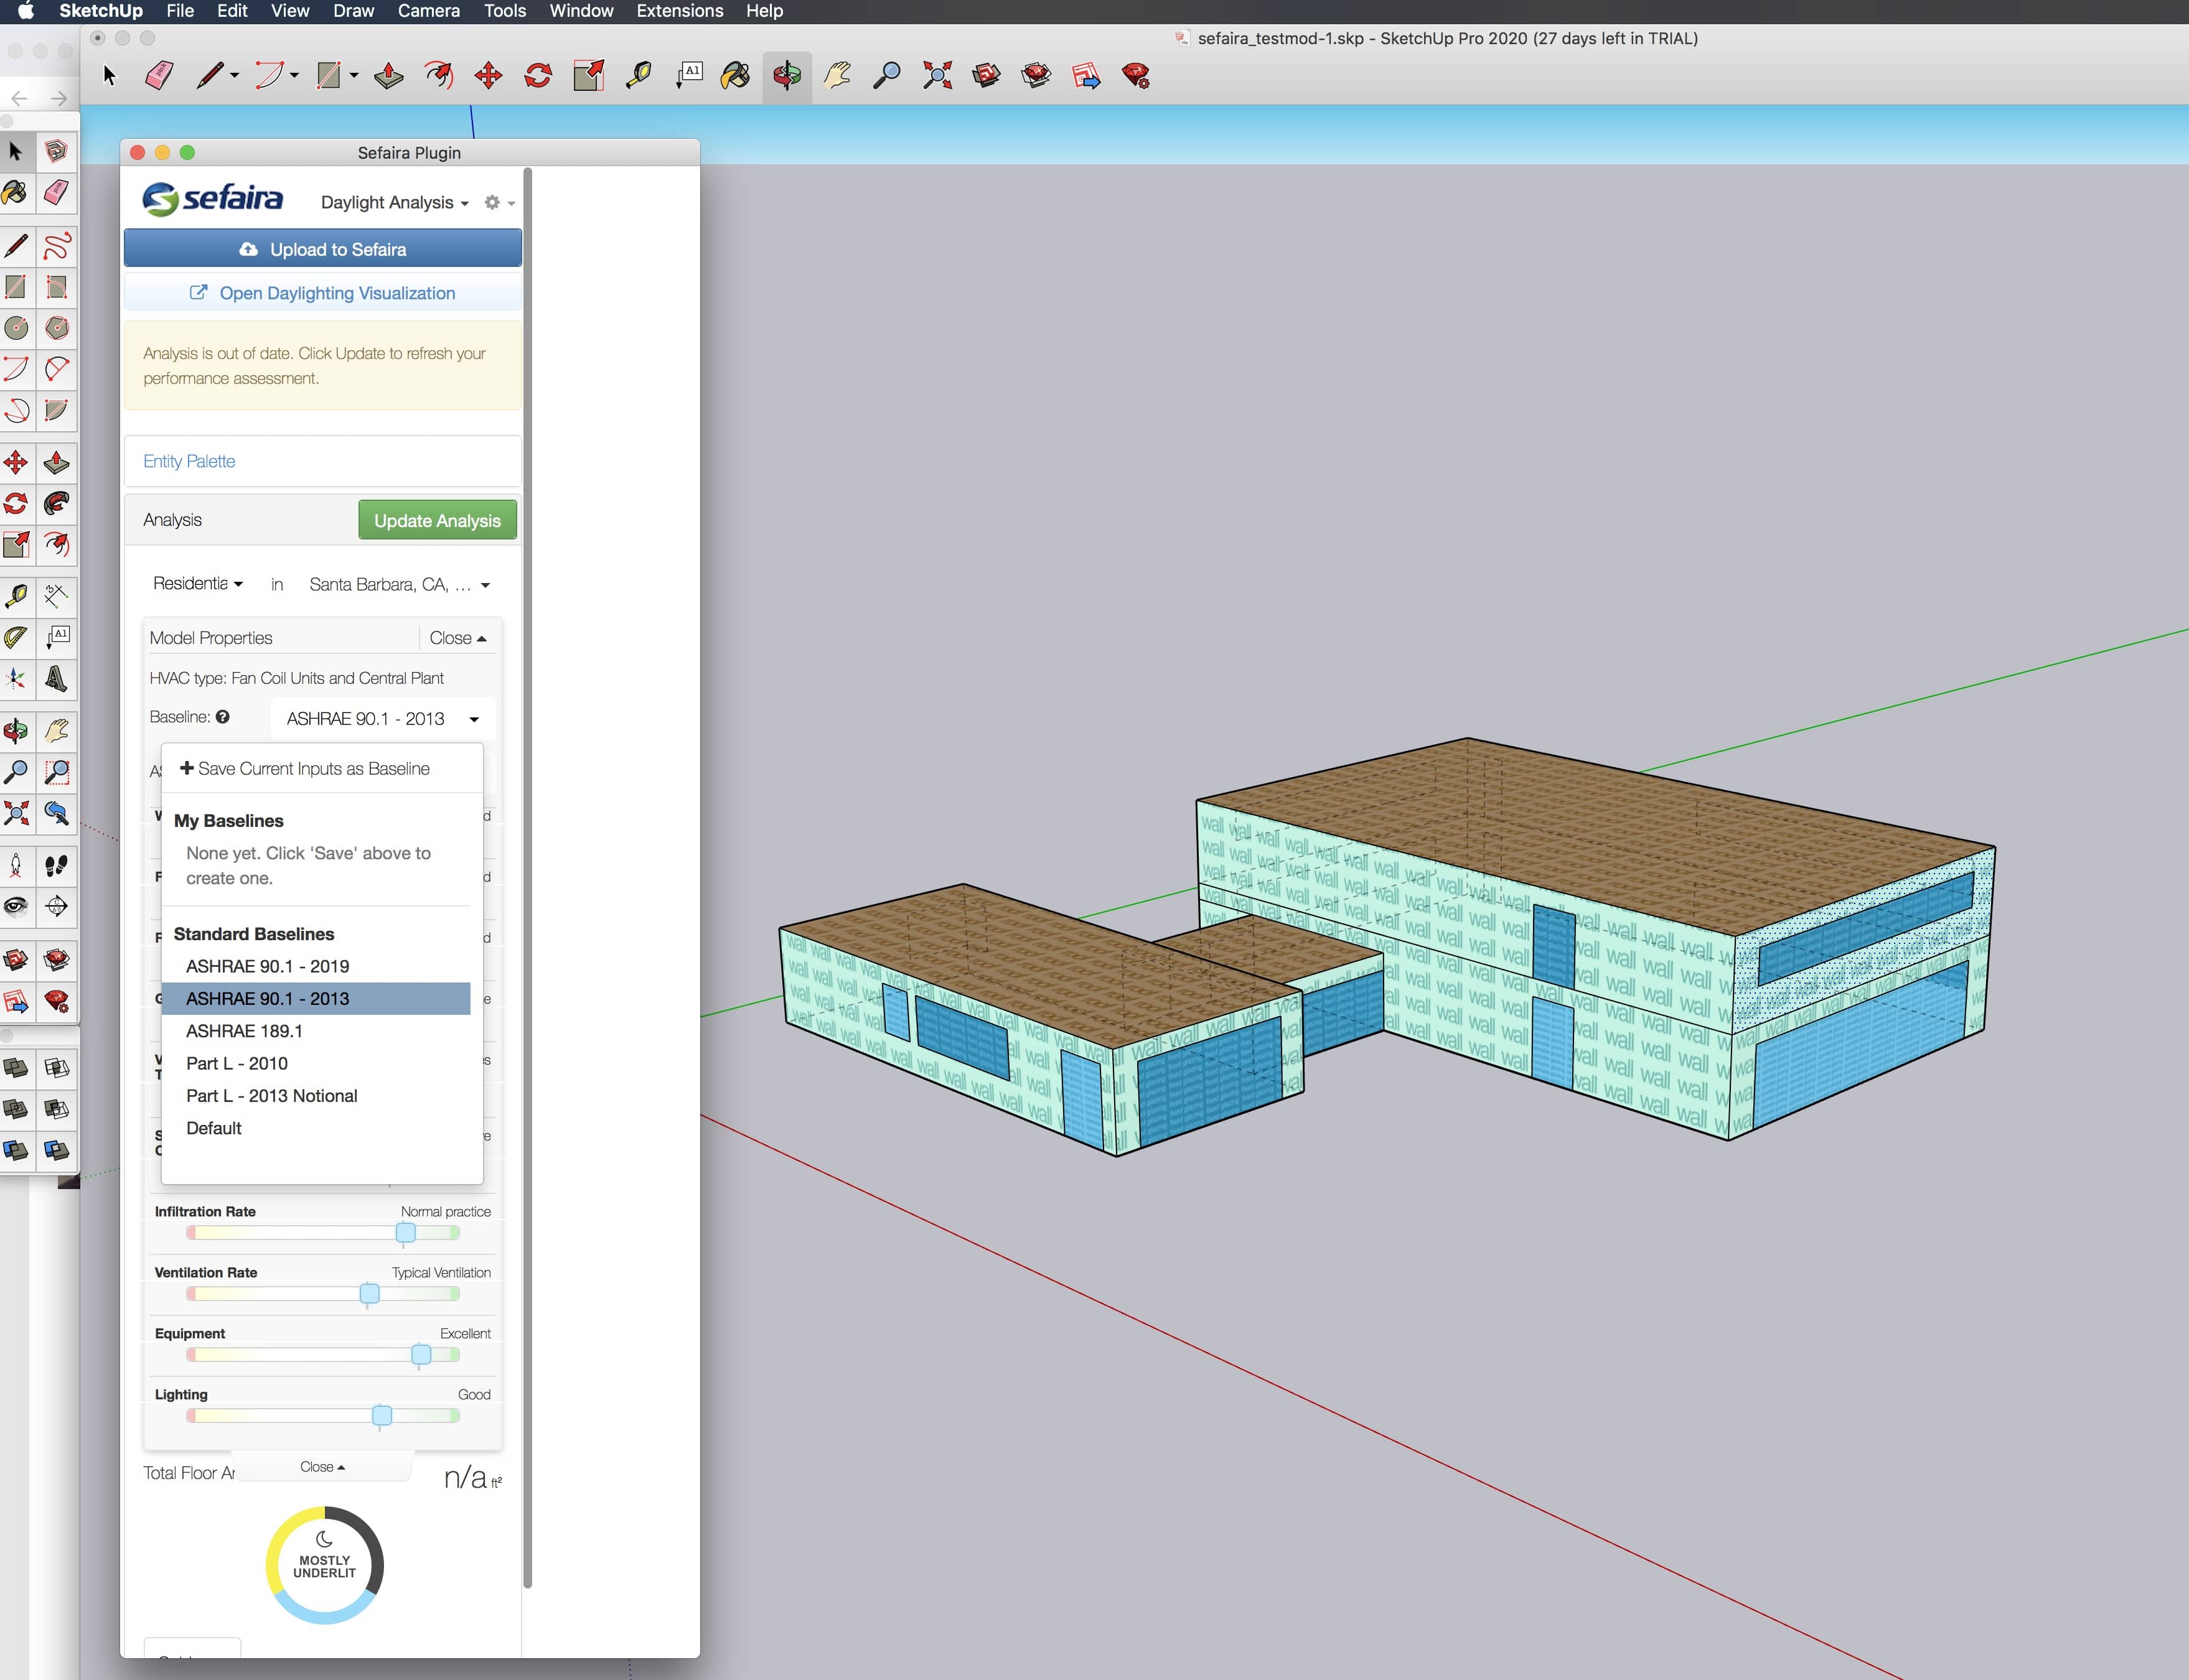
The Sefaira plugin palette can at first be confusing. You use it to prepare your model for analysis by selecting: (1) location, (2) building/use type, and (3) Properties, importantly baseline energy model for analysis like ASHRAE 90.1 – 2013.
The next button is the Entity Palette. By default, it should look like the image above. It lists the envelope components used by Sefaira. To produce your model for Sefaira you need simple “planes” for all these elements (no thicknesses needed). So draw your model like its a paper or cardboard physical model. Create rectangles for your glazing elements. Do not sub-divide large glazing window walls like curtain walls. There is no need and it will not affect your outcome. It only makes your modeling process longer. You can manually select elements on the model (specific planar objects) and right-click and select Sefaira Plugin > Tag as roof, for example. Or you can hit the button Show Entity Types and Sefaira will take a stab guessing your object types. If it gets it wrong, you can manually select it.
For example, in an all-glass connector between my two main volumes of my building, I have selected two panels of glass to be “fixed glazing” while the center is “operable glazing.” These two types matter for energy analysis.
Running The Sefaira Analysis
Now that our SU model is ready for Sefaira one can select the Analysis button at the bottom (not the Update Analysis button). This palette expands showing the insulative values for walls, roofs, floors, glazing U-factors, SHGC, Visible Light Transmittance (VLT), etc. These settings are driven by building use types. To do this you choose with the drop-down menu under the Analysis button on the left side. The right side is devoted to selecting your building location but you actually type in your location in the “Enter your project location” field and hit the Set Location button below that field.
Hit the Properties button now directly under the Set Location button and the palette expands showing those insulative values. We can adjust these sliders for insulative values individually or leave them on defaults. You can also select your ASHRAE Climate Zone (1-8).
For the first-time Sefaira user, one can be overloaded by what analysis to learn first. One simple goal would be to focus on daylighting analysis first, rather than energy analysis. In fact, you can select to run just Daylighting, Energy, or a combo of the two for your analysis.
Learning Sefaira
Chances are if you are zeroed into this review you may be new to energy and daylighting modeling with any kind of application, much less Sefaira. Trimble provides a good set of resources for learning Sefaira with an entire “New to Sefaira” section under Sefaira Support online.

Trimble provides extensive help and instructional videos and information for learning Sefaira.
Architects new to Sefaira will already have a better intuitive sense of daylighting analysis and its value. This is a good place to start learning Sefaira. Selecting Daylighting by itself means your analysis will also run faster than if you select Energy & Daylighting analysis.
Daylighting Analysis
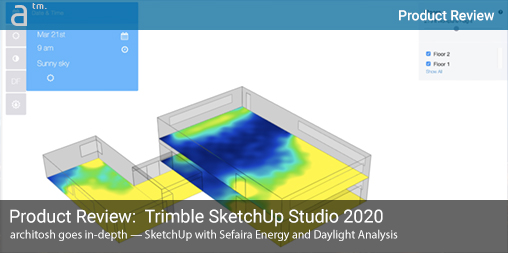
Completing a run on Daylighting will yield visual graphics representing the “daylighting analysis.” The round dials in the interface give you a top-level summary of your daylighting results on an annualized basis. In our test building, we are mostly overlit. On an annual basis, 41 percent of the floor area annually is overlit, 25 percent is well lit, and 35 percent is underlit, based on standardized criteria for building occupancy type. (see image below).
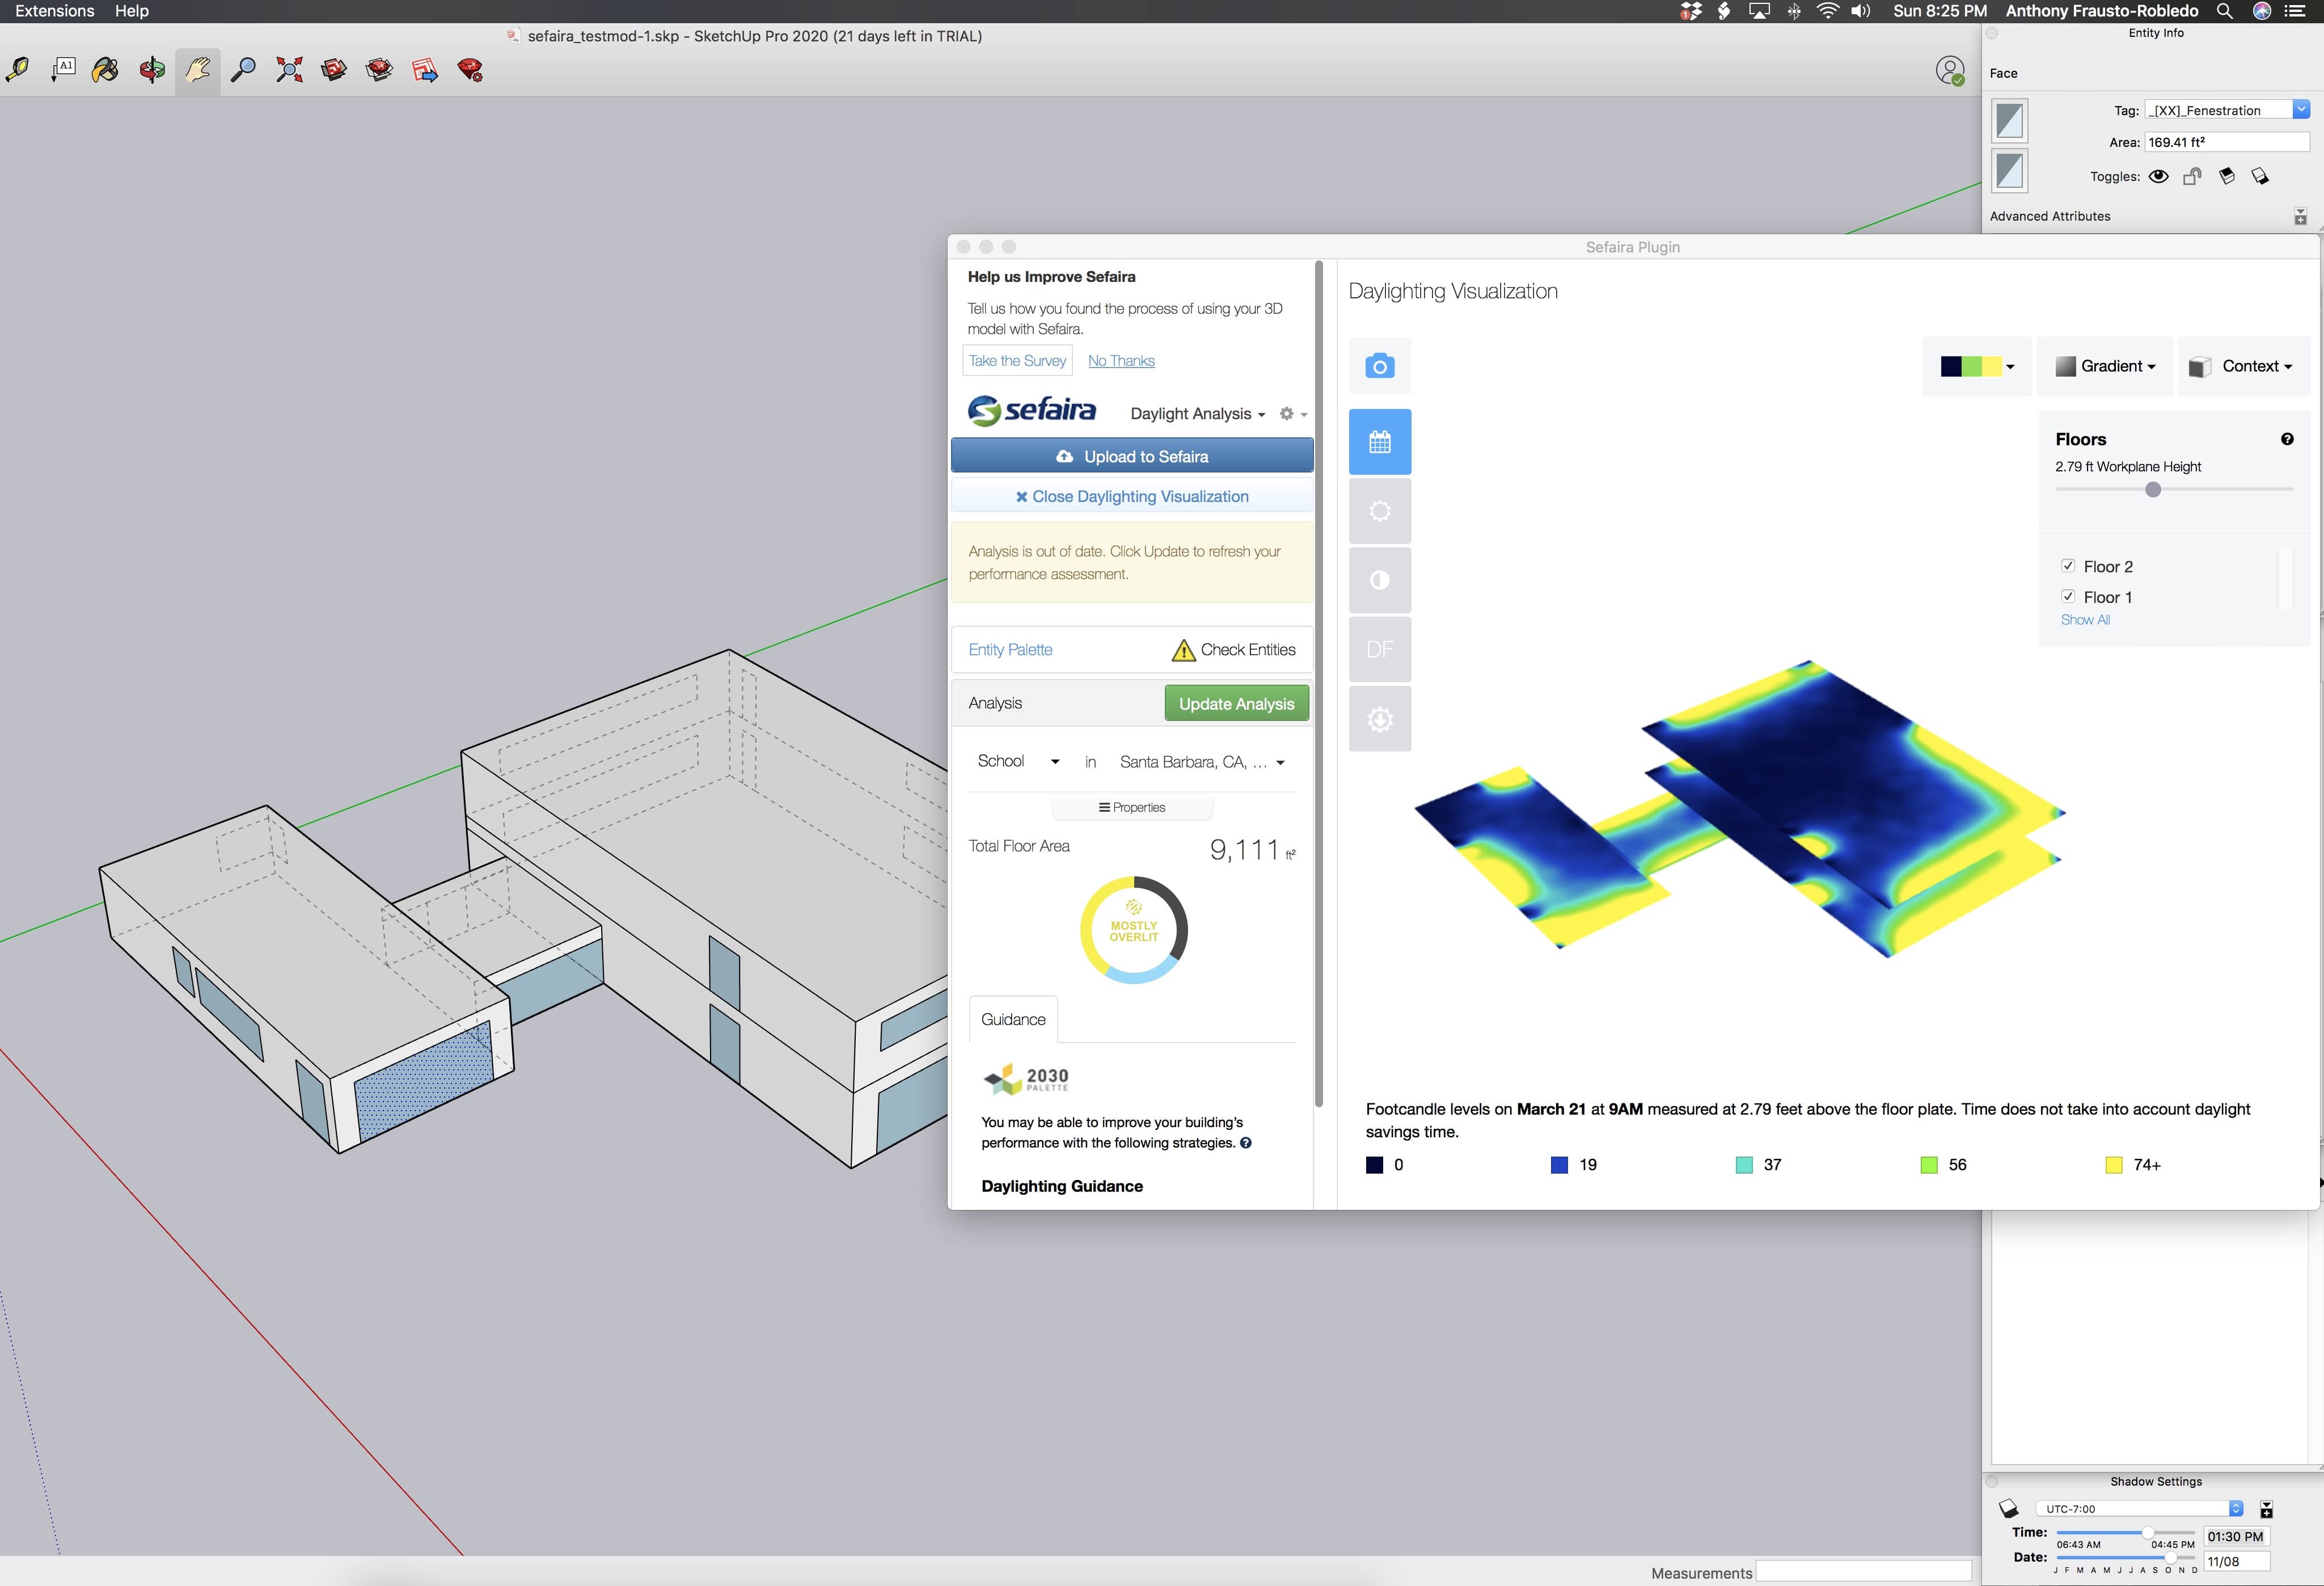
To spin a model in Sefaira’s interface post analysis, you must rotate it in SketchUp. As you do it updates in real-time in Sefaira. You can export the analysis graphics as a whole or per floor. Per floor is useful if you want to overlay those graphics inside SketchUp itself, which is how to get the kind of images Trimble shows on their website for SketchUp Studio.
There are actually five different daylight analyses to do, including Date and Time, Annual, Over & Underlit, Daylight Factor, and Direct Sunlight. The default in Sefaira is the Annual analysis and is considered the best option for early-stage design considerations. This analysis performs an “hour by hour” annual daylight analysis using weather data from the location selected in the Sefaira palette. Our location for our test model is Santa Barbara, California, my childhood home town. The metric is daylight autonomy, or how often is the space sufficient with daylighting alone. It shows a percentage of occupied hours that meet a minimum level of illumination from daylight alone, measured in lux (300 is the default).
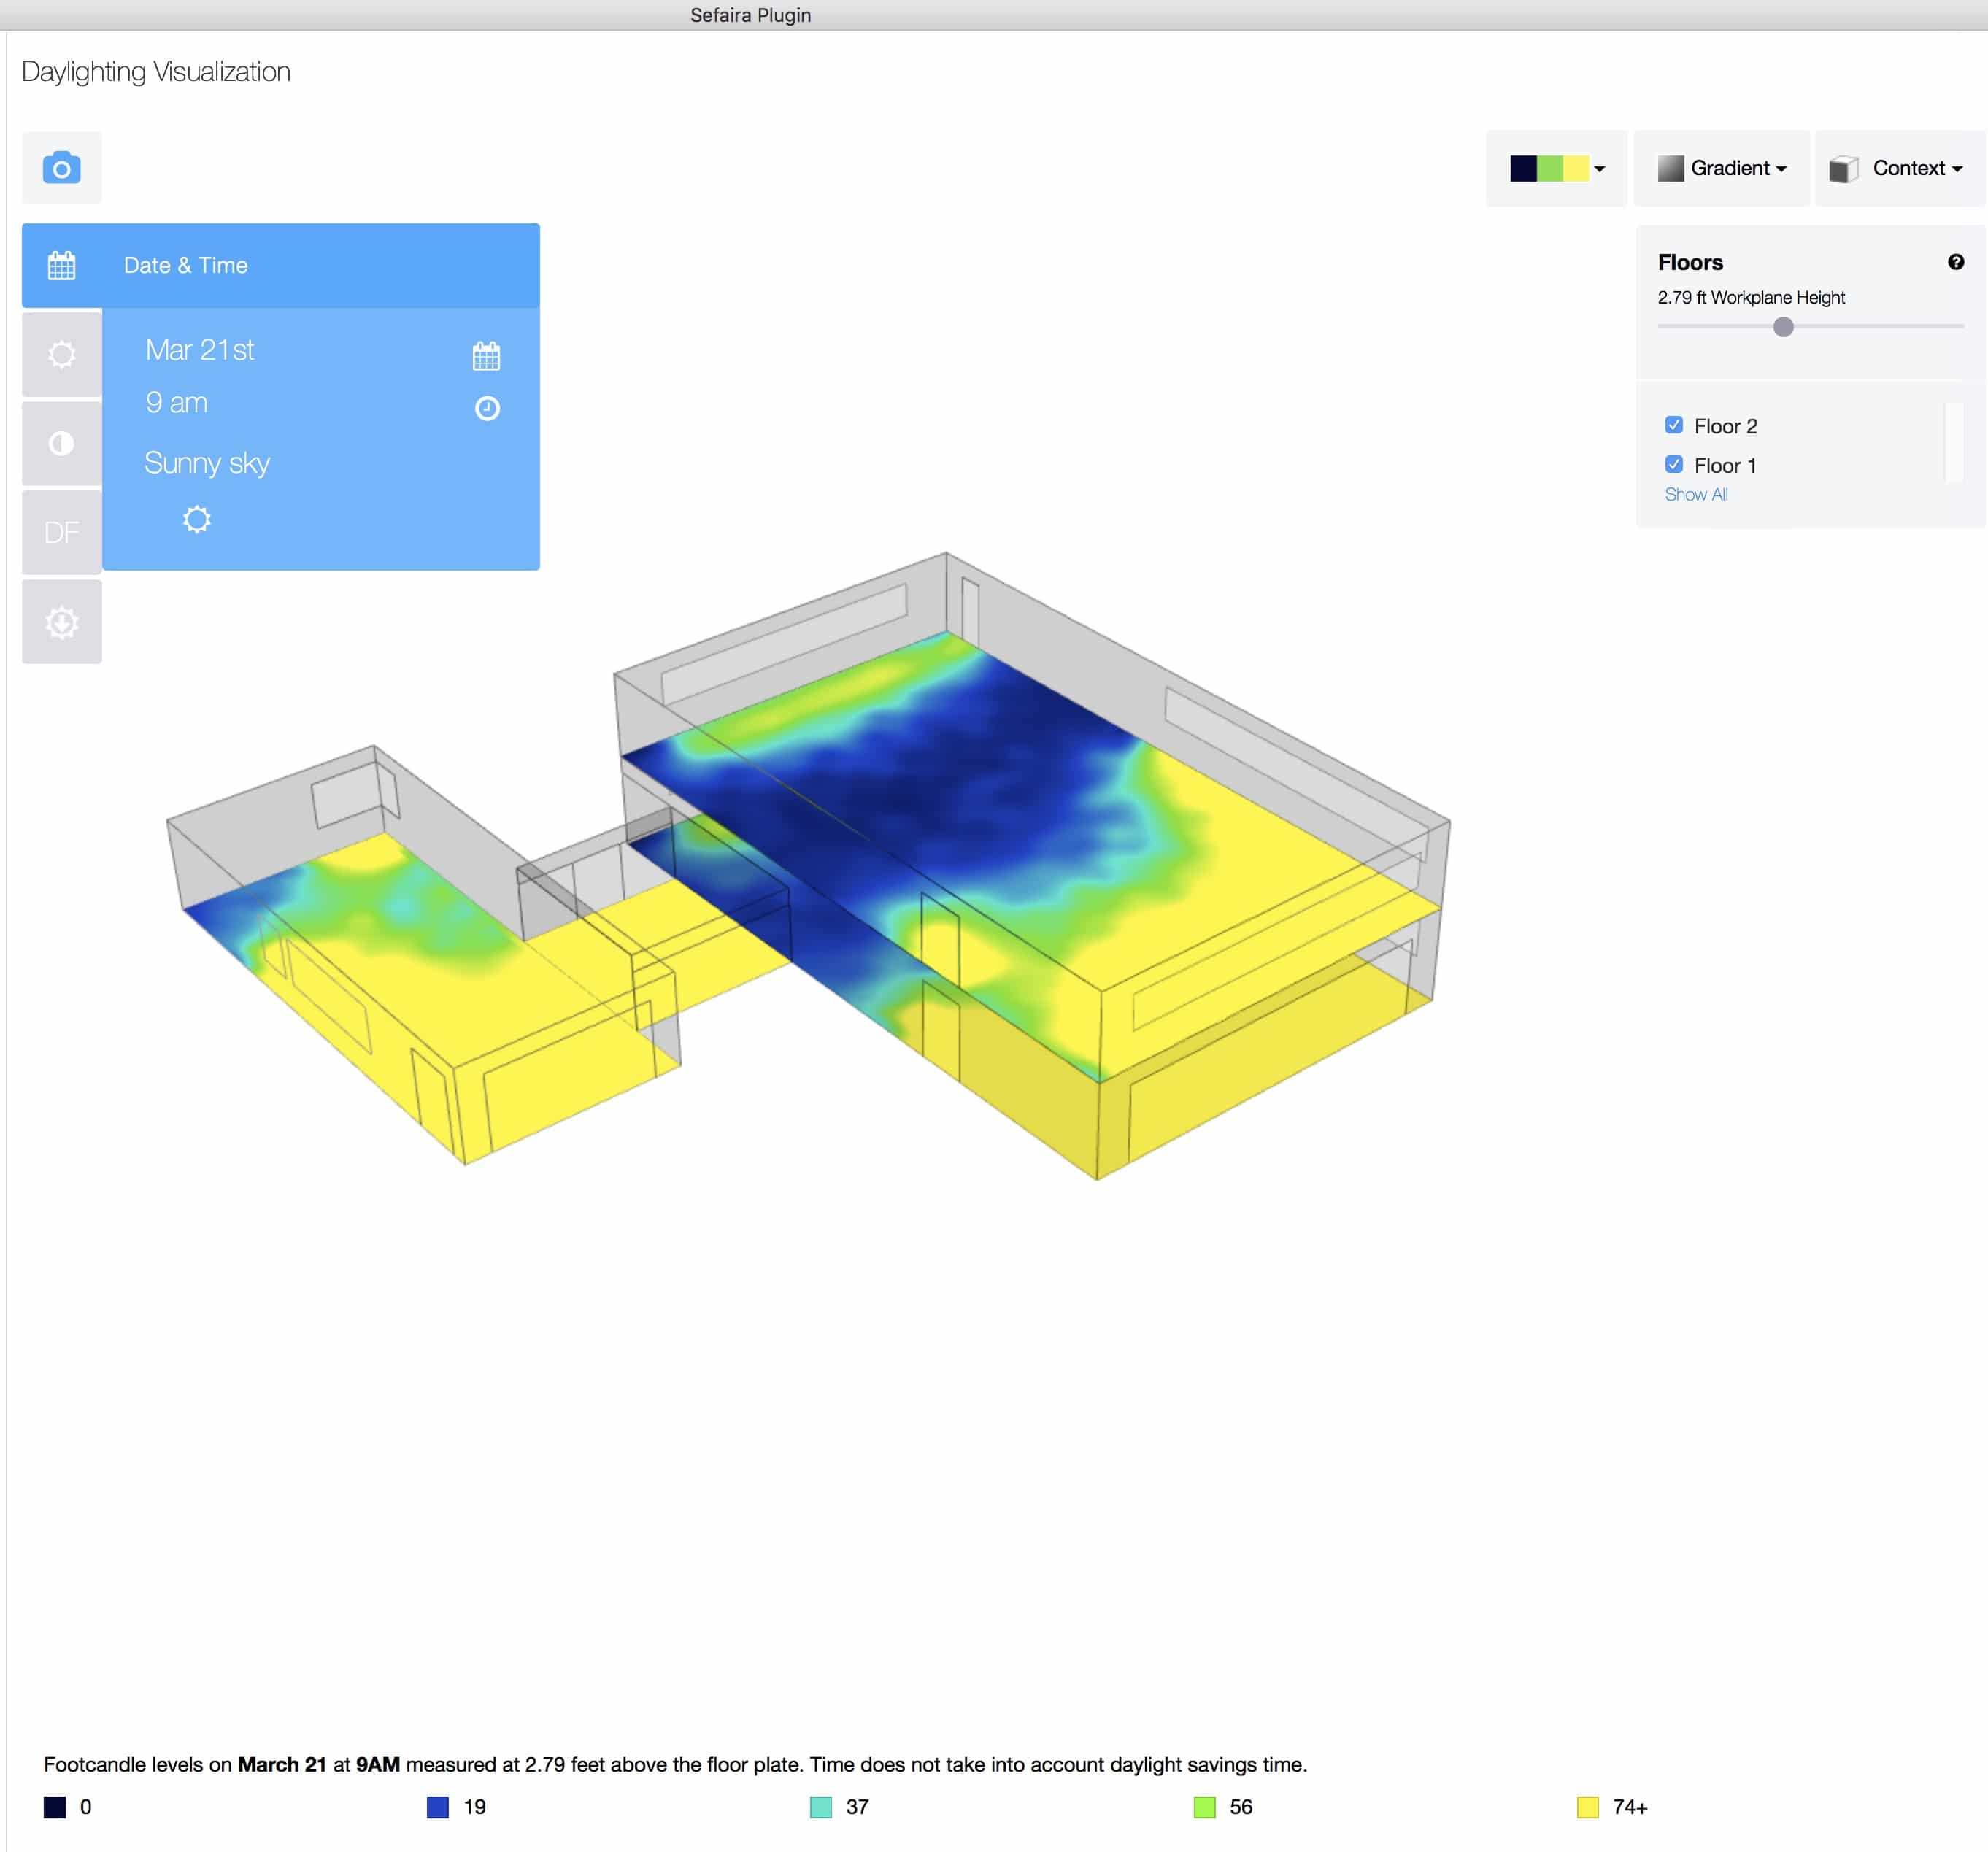
Date & Time analysis. Used to spot worst and best cases. (click image)
Annual daylight analysis. Best default analysis.

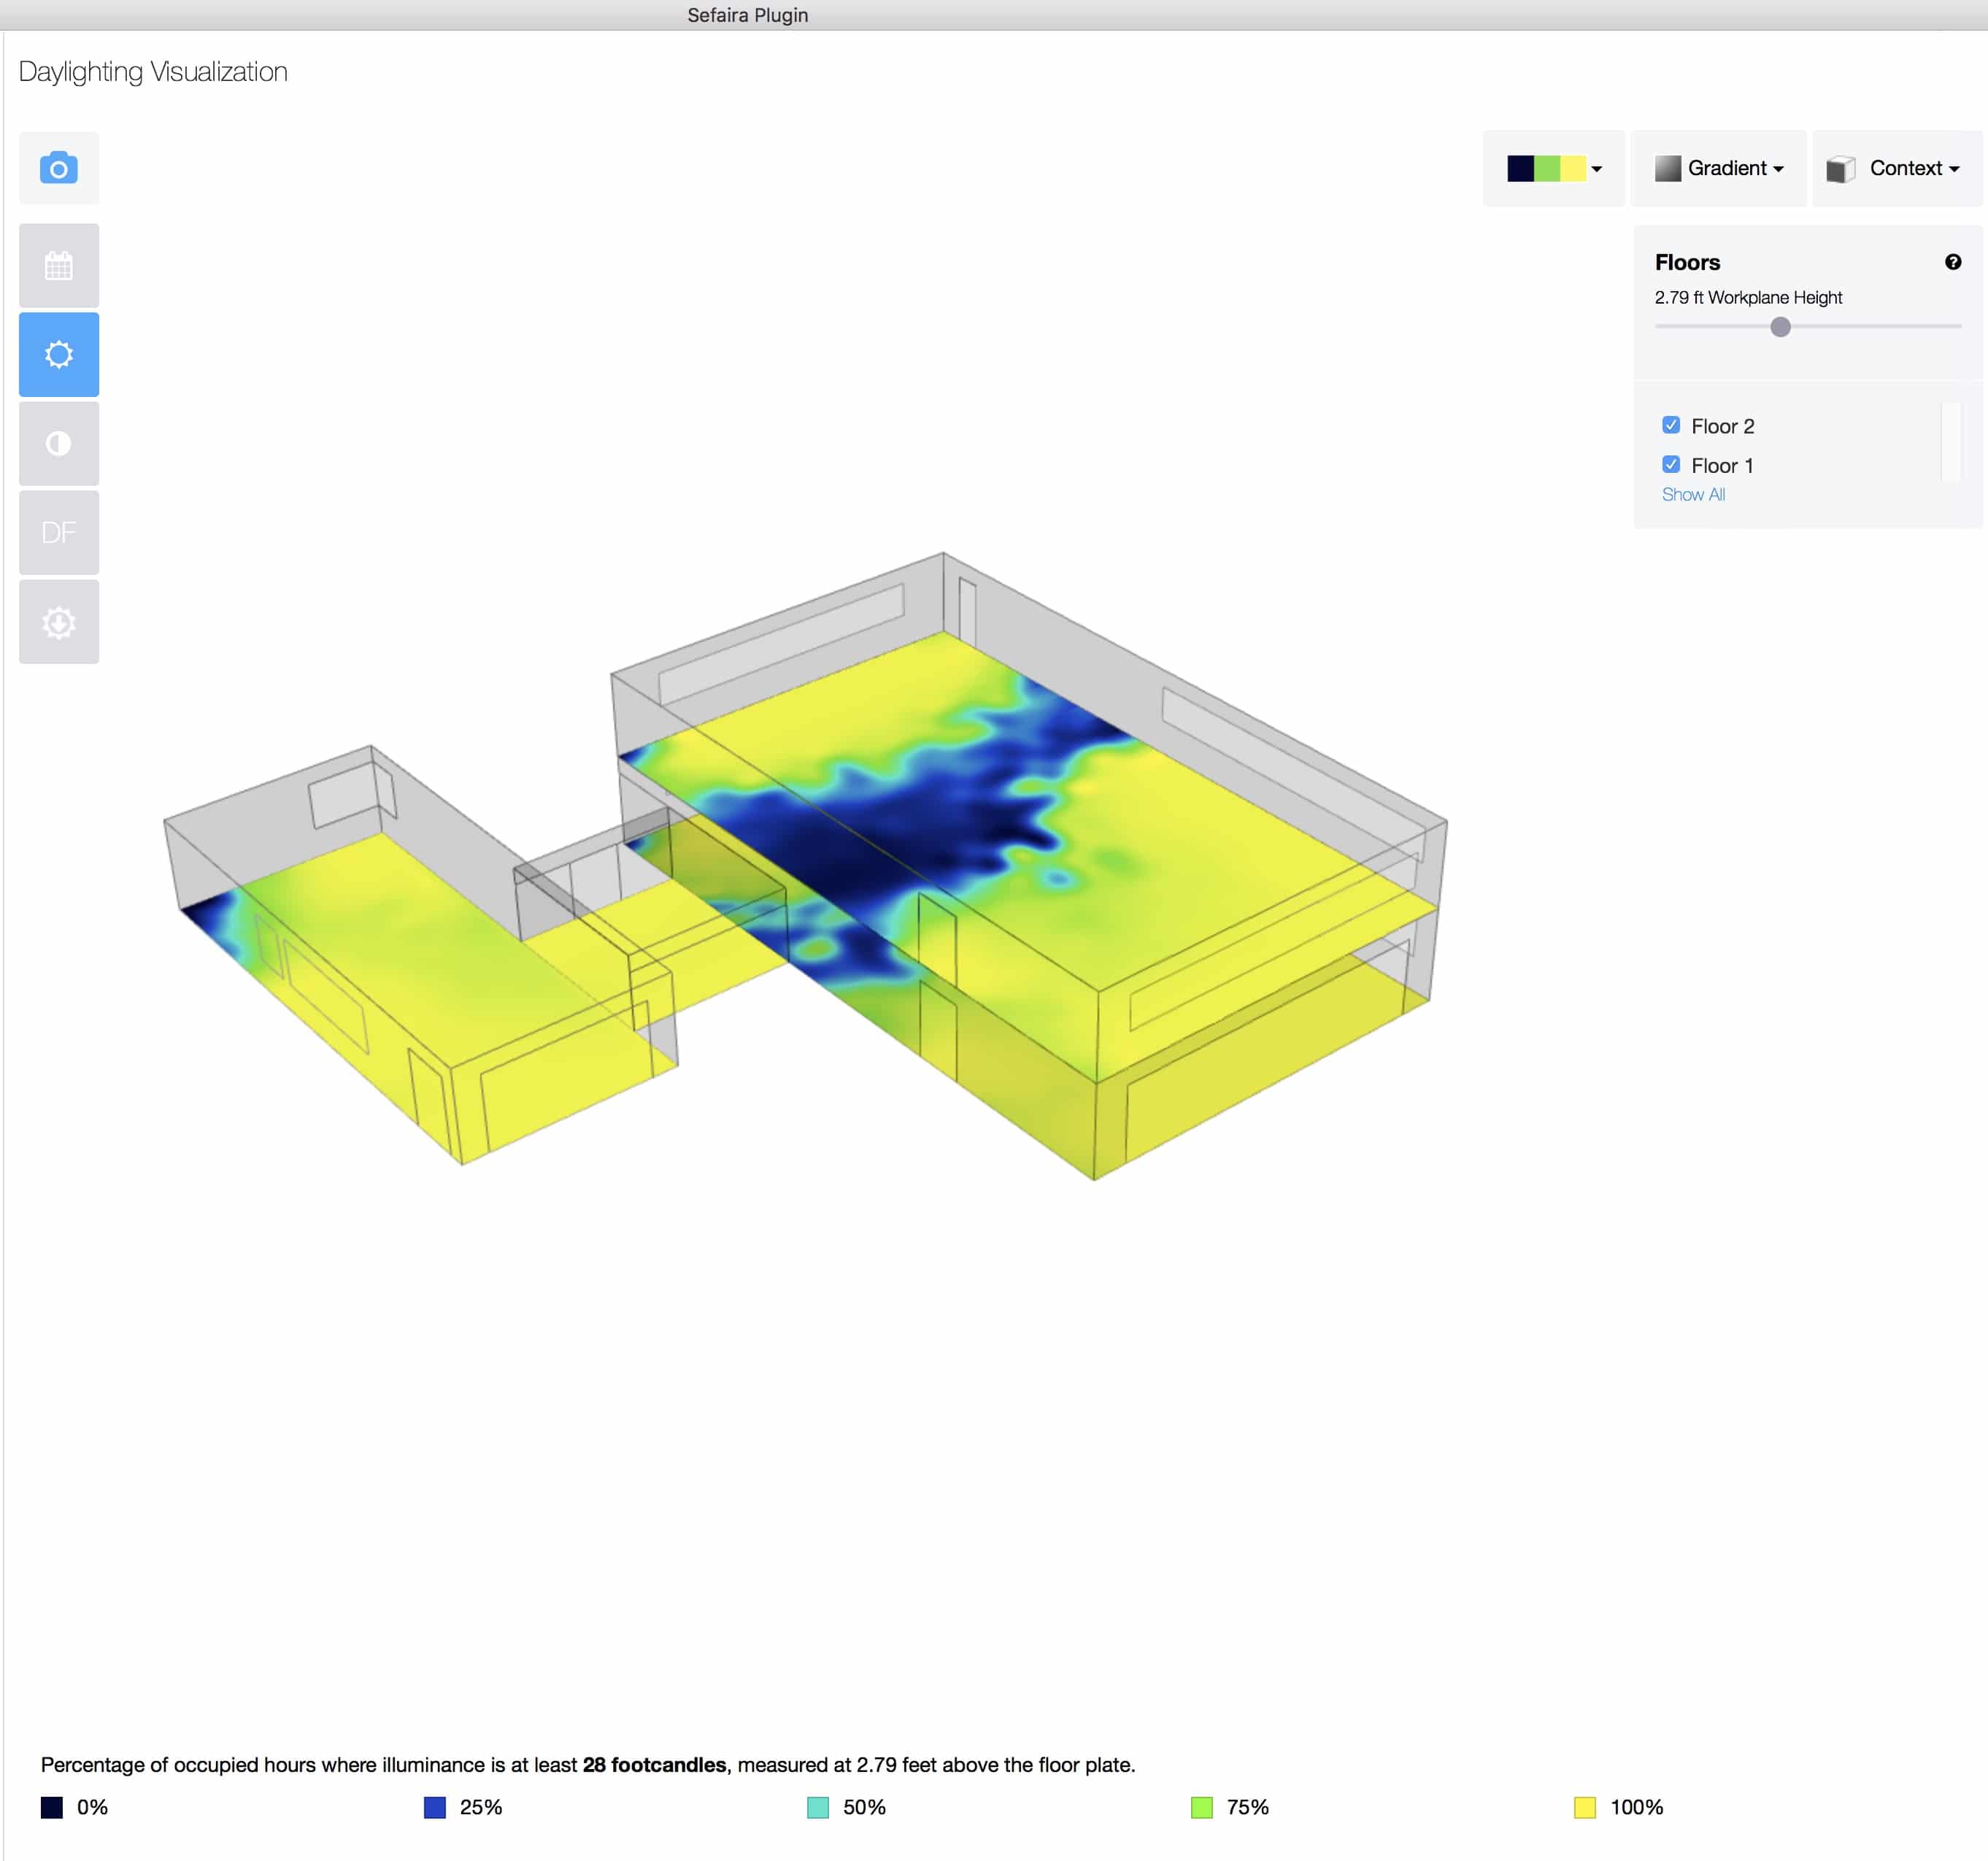
Overlit & Underlit analysis used for LEEDv4 benchmarking.
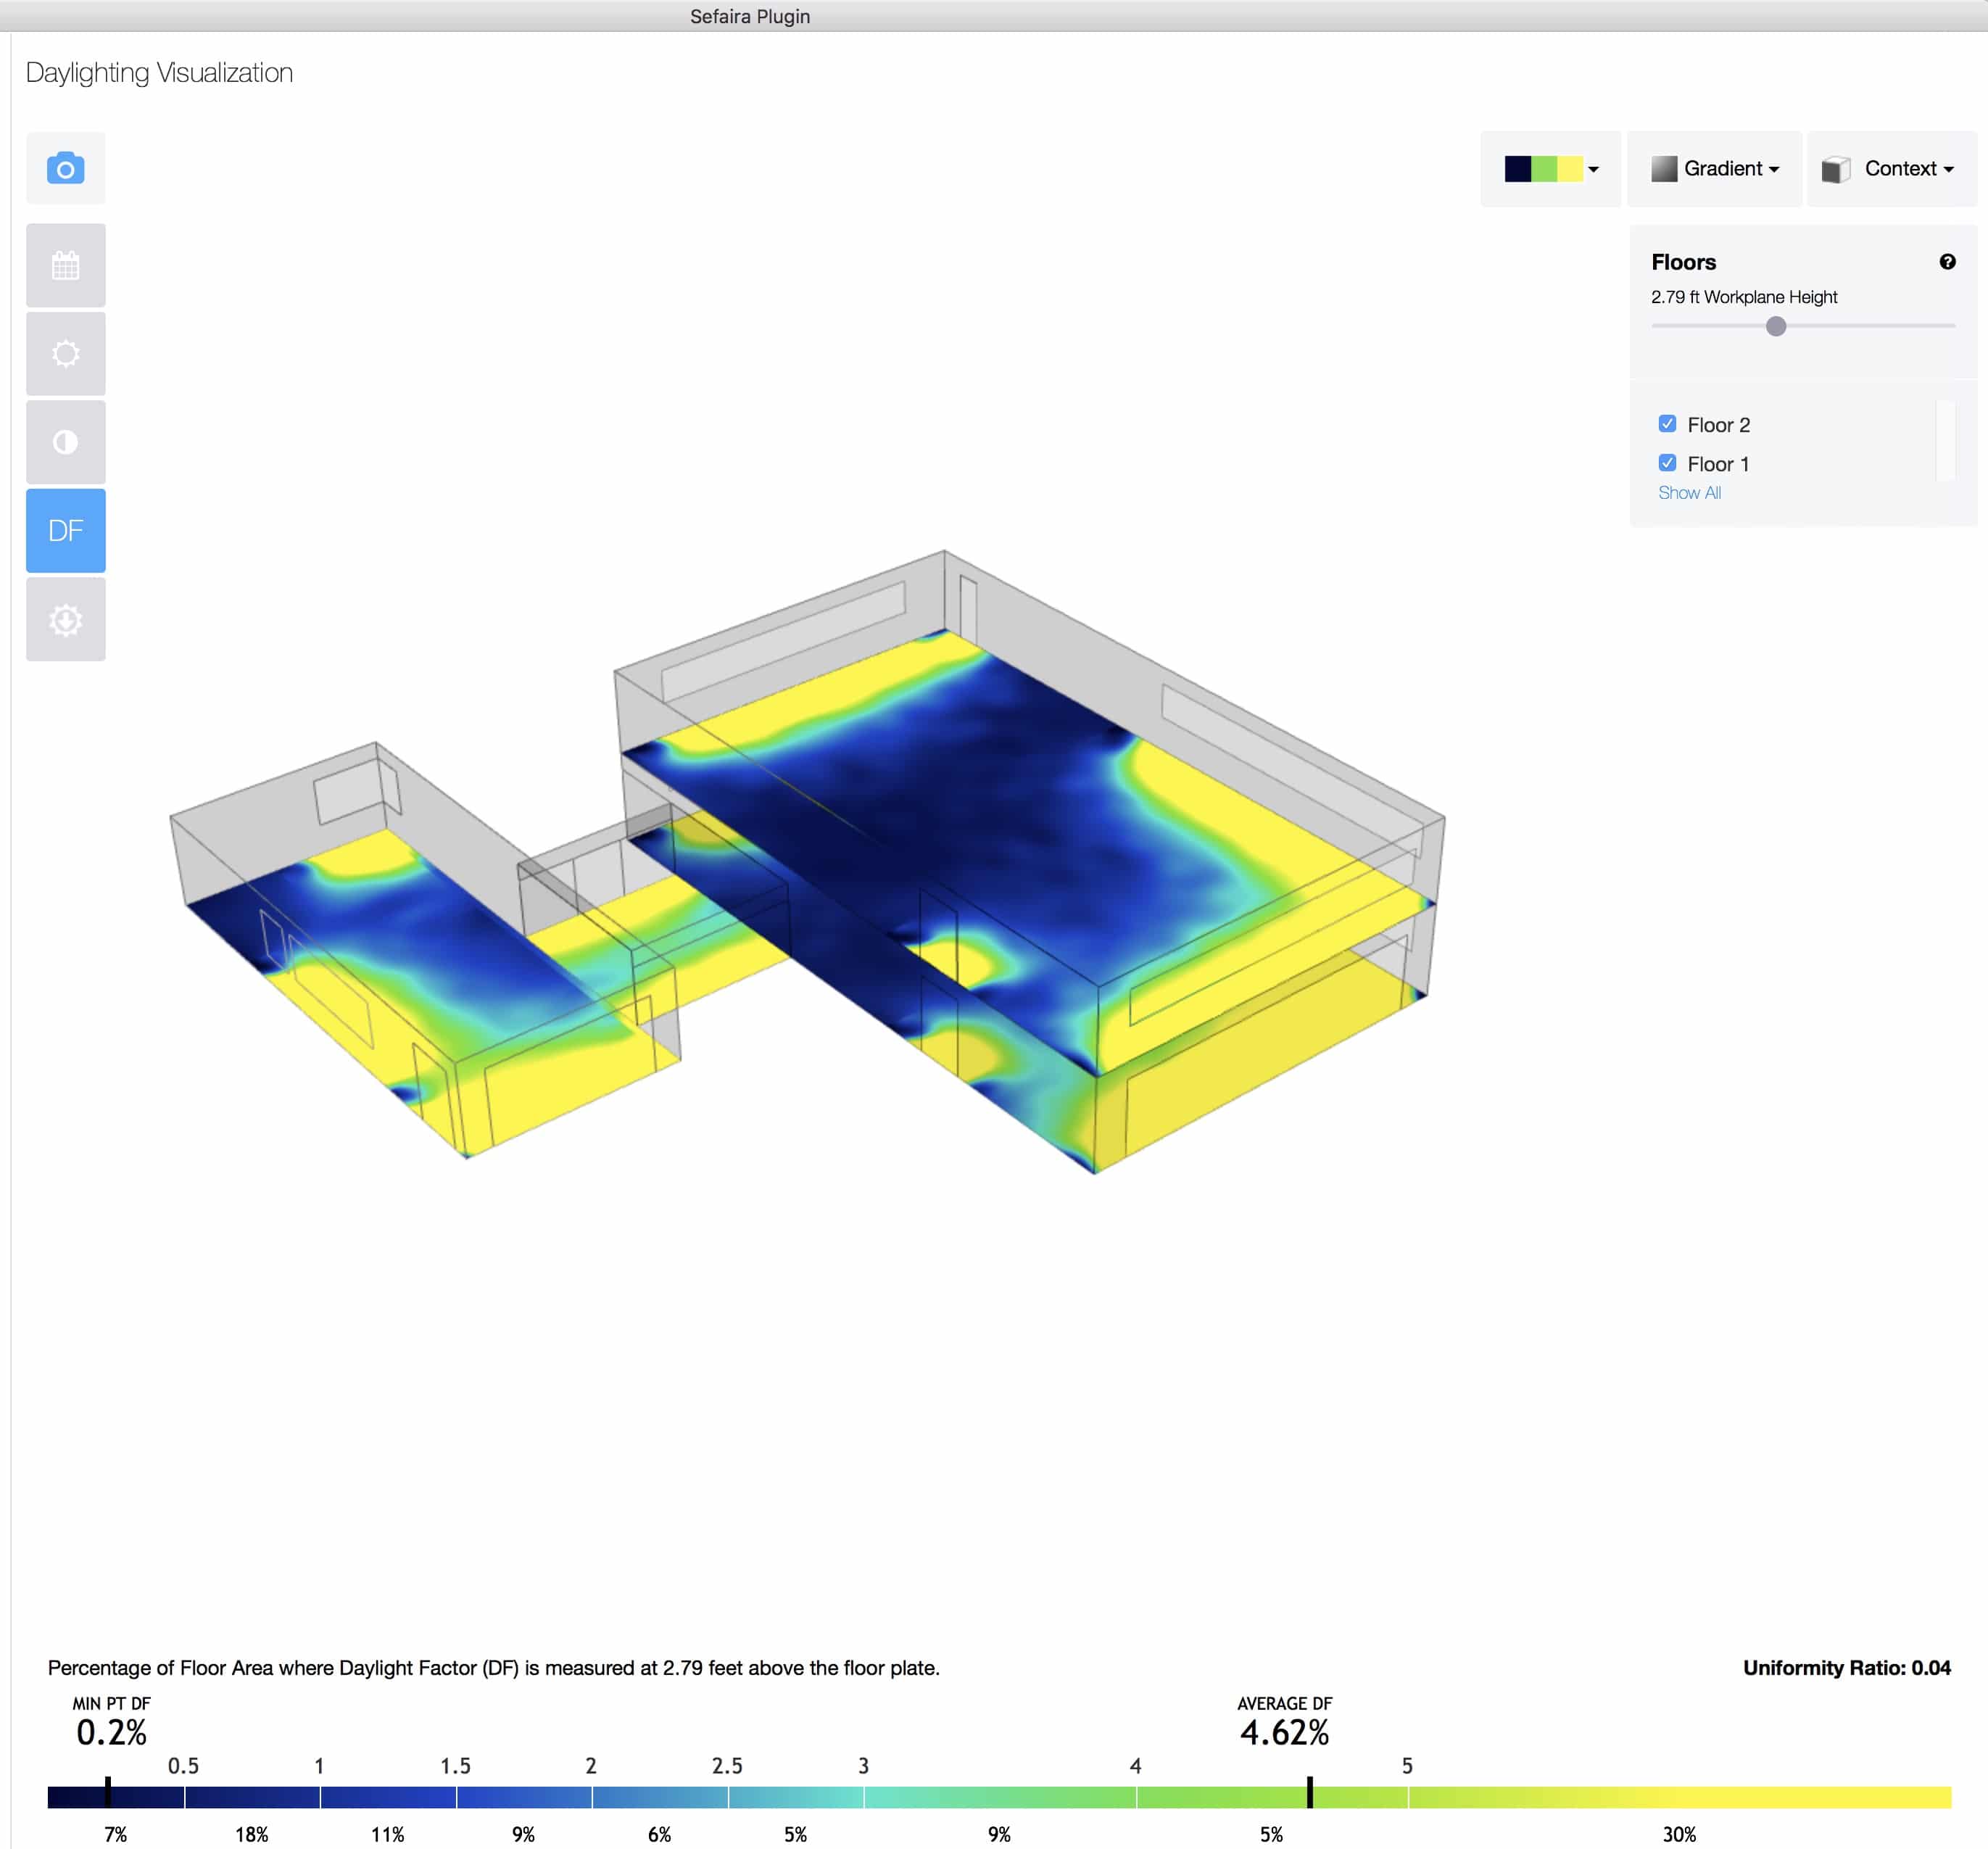
DF. Daylight Factor is the ratio of the exterior to interior illuminance under an overcast sky.
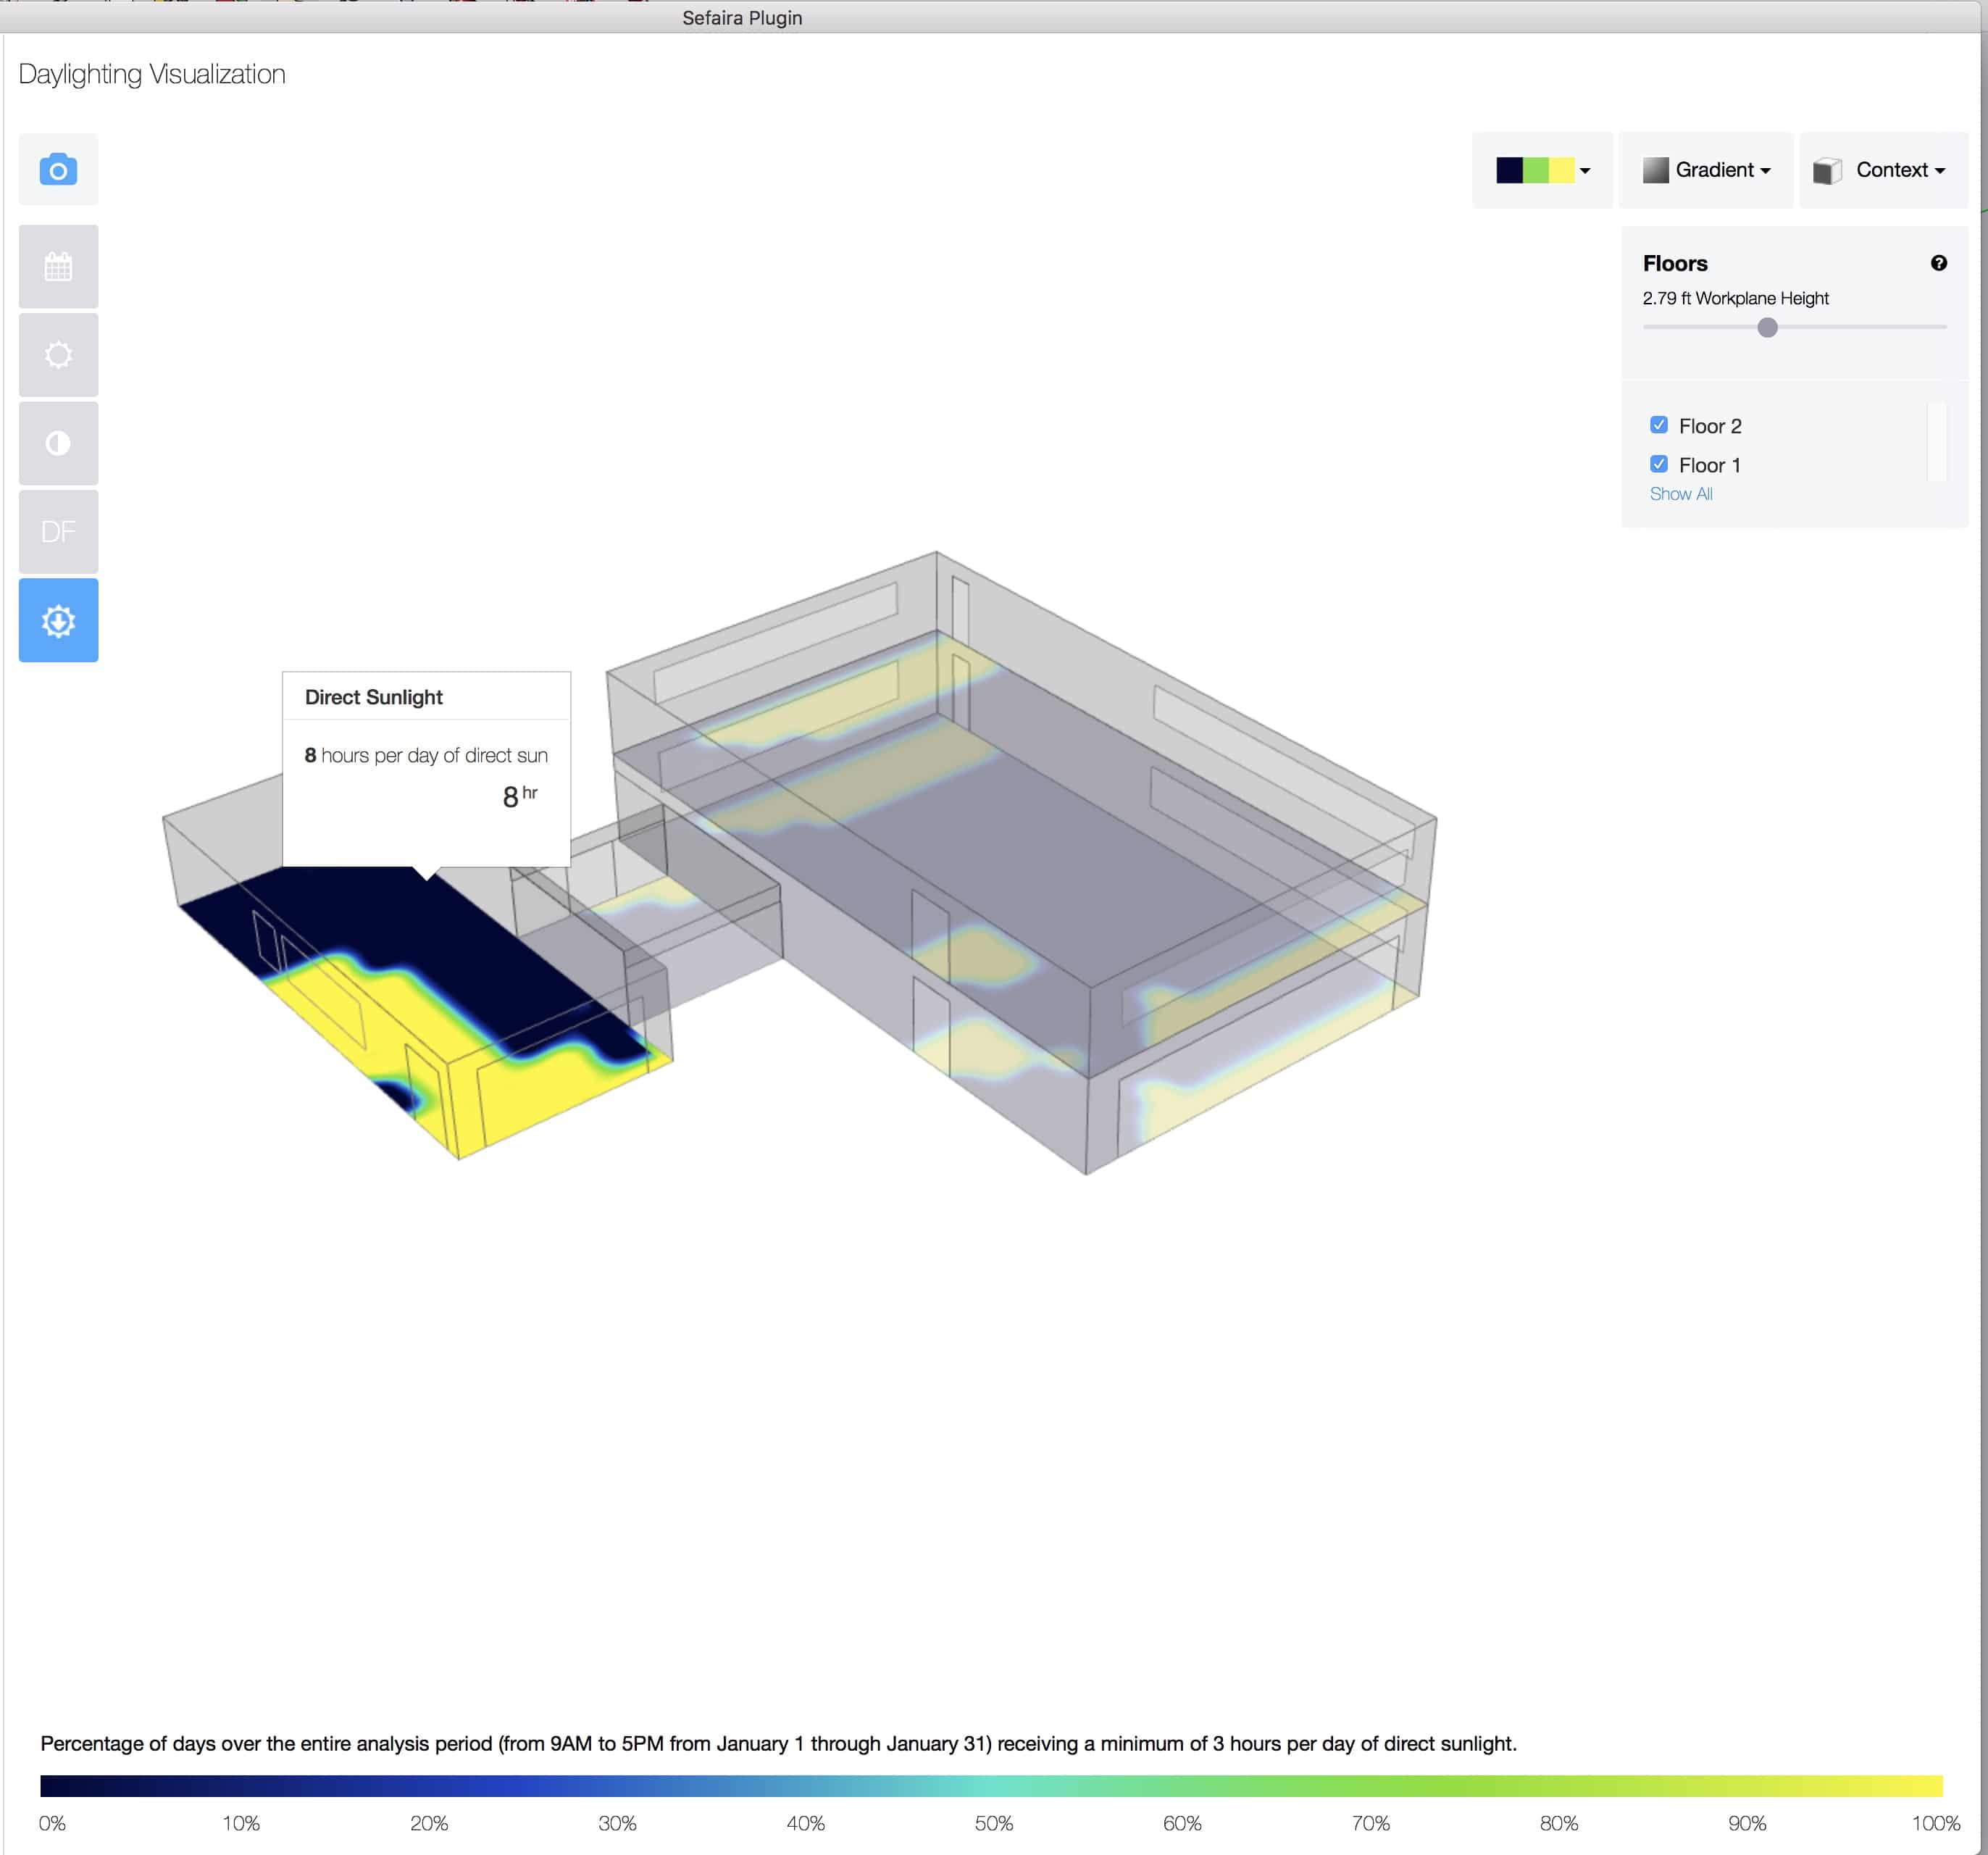
Direct Sun. This analysis is good for evaluating direct sun hour percentages used in some codes.
We will not go over all five different daylighting analysis options in detail but Date and Time are good for examining best and worse case conditions throughout the year, as seasonal fluctuations can be really dramatic based on project location. Over & Underlit checks for exactly what you think it does, finding spaces that are shy of 300 lux or over 100o lux. With this analysis, you can drag your cursor over the model and get data room by room. The threshold data for this analysis aligns with the LEED v4 daylight credits. Daylight Factor is a ratio of the exterior to interior illuminance under an overcast sky. Direct Sunlight analysis provides percentages of days that receive a minimum number of hours of direct sunlight every day, over a given time and span. So you could look at winter versus summer months, for example. This analysis is good for passive solar design studies. You can design for the maximum direct sun in winter months and with shading devices minimum hours in summer months. You can also assign exterior courtyards and other spaces and analyze for sunlight in those important exterior areas.
LEED v4
Sefaira daylighting analysis tools can be used to do early-stage LEED v4 daylighting benchmarking. It is not a compliance tool, however. Over & Underlit analysis corresponds to the LEED v4 daylight credit, option 1, simulation of daylight autonomy, and annual sunlight exposure. LEED provides credits for 50, 75, 90, and 100 percent daylight autonomy, and different points are associated with each percentage range.
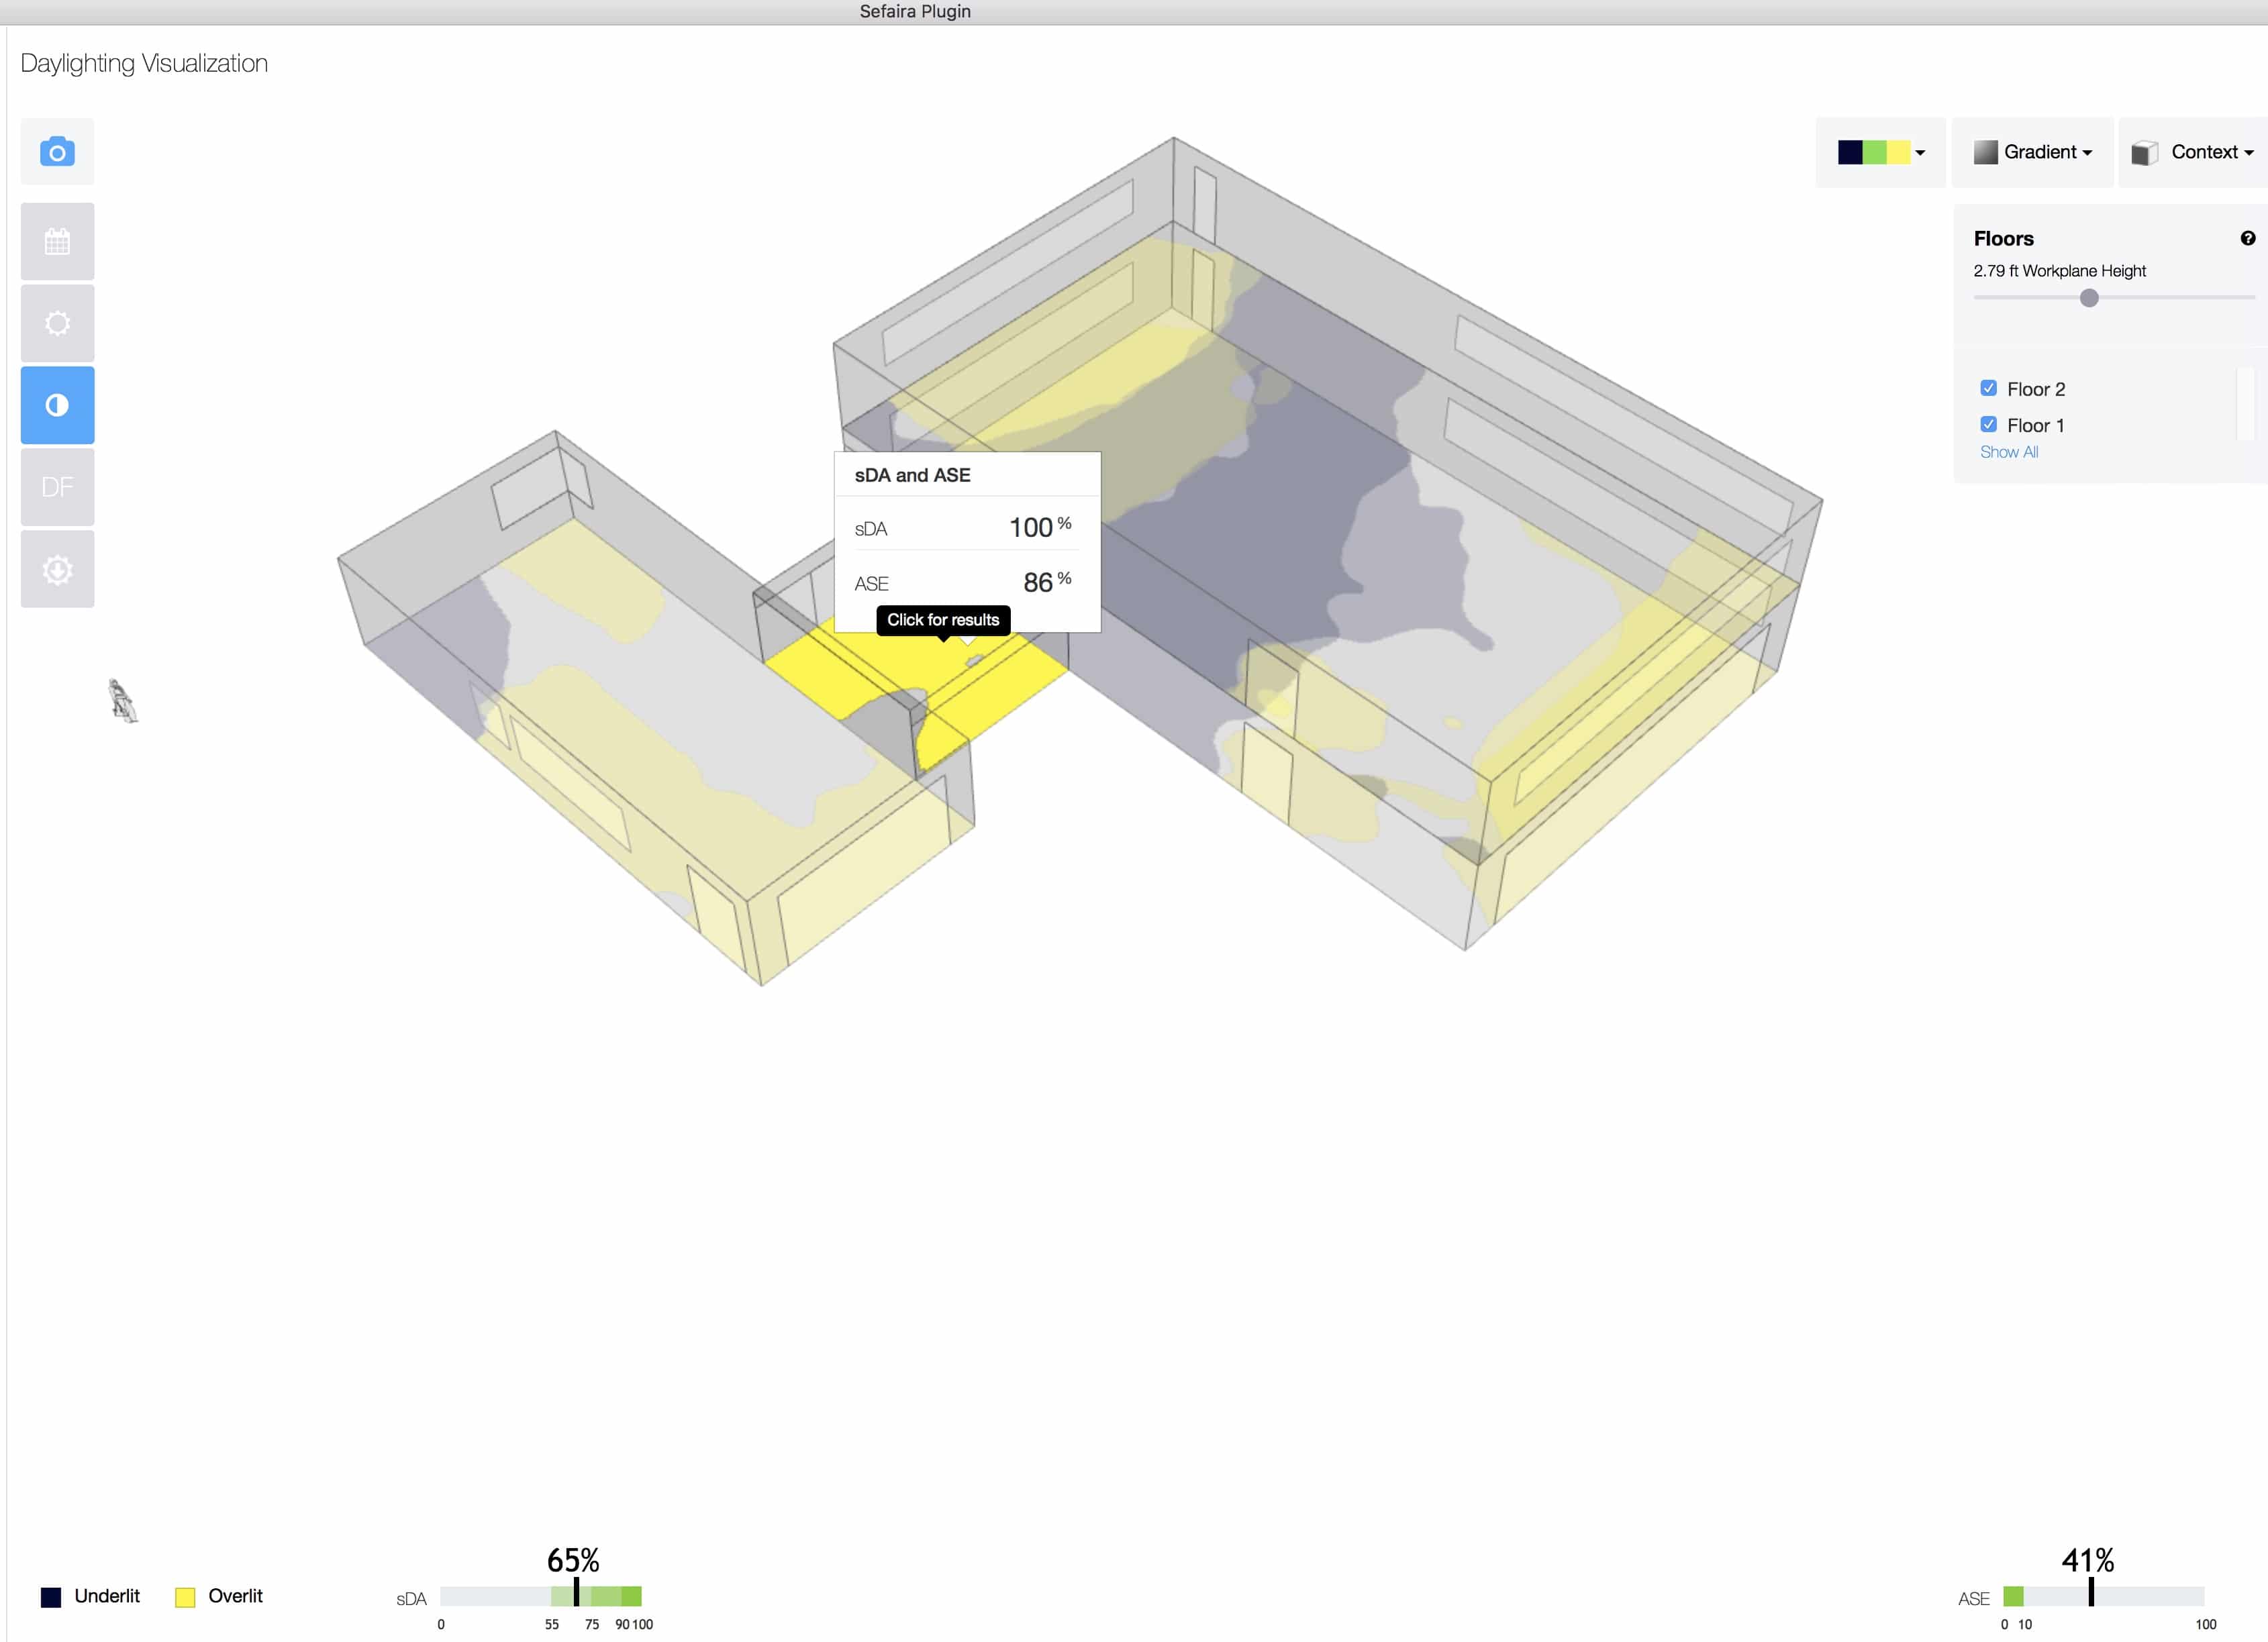
The Over & Underlit analysis shows me individual rooms. The Glass Connector is highlighted above with its own values.
This corresponds to the percentage of areas of your building that obtain enough light from daylight alone. For example, in my test building, the small residential side of the structure has an “sDA value” of 86 percent. And the glass connector has 100 percent. Such a space has sufficient lighting from daylighting alone during occupied hours, meeting the minimum level of illumination. Overall, the total project is at the 65 percent mark on the analysis and is likely qualifiable for the LEED daylighting credit.
Overlit & Underlit is one of the daylighting analysis tools useful to early-stage LEED v4 daylighting analysis determinations. The “sDA” score is 65 percent which puts me in the range of scoring some LEED points for simulation of daylight autonomy.
As you can see, Sefaira’s tools add significant value to SketchUp for making critical decisions about design options around daylighting criteria.
Sefaira Web Analysis
SketchUp Studio not only comes with Sefaira plugin for SketchUp Pro but also support for the Sefaira Web App.
The Sefaira Web App is a highly detailed and technical option for the SketchUp Studio user. It enables the user to create a baseline concept and clone the baseline and run alternative scenarios on it, like changing the HVAC type. You can see annual energy cost projections in dollars. And you can also upload a project to the AIA 2030 Commitment.
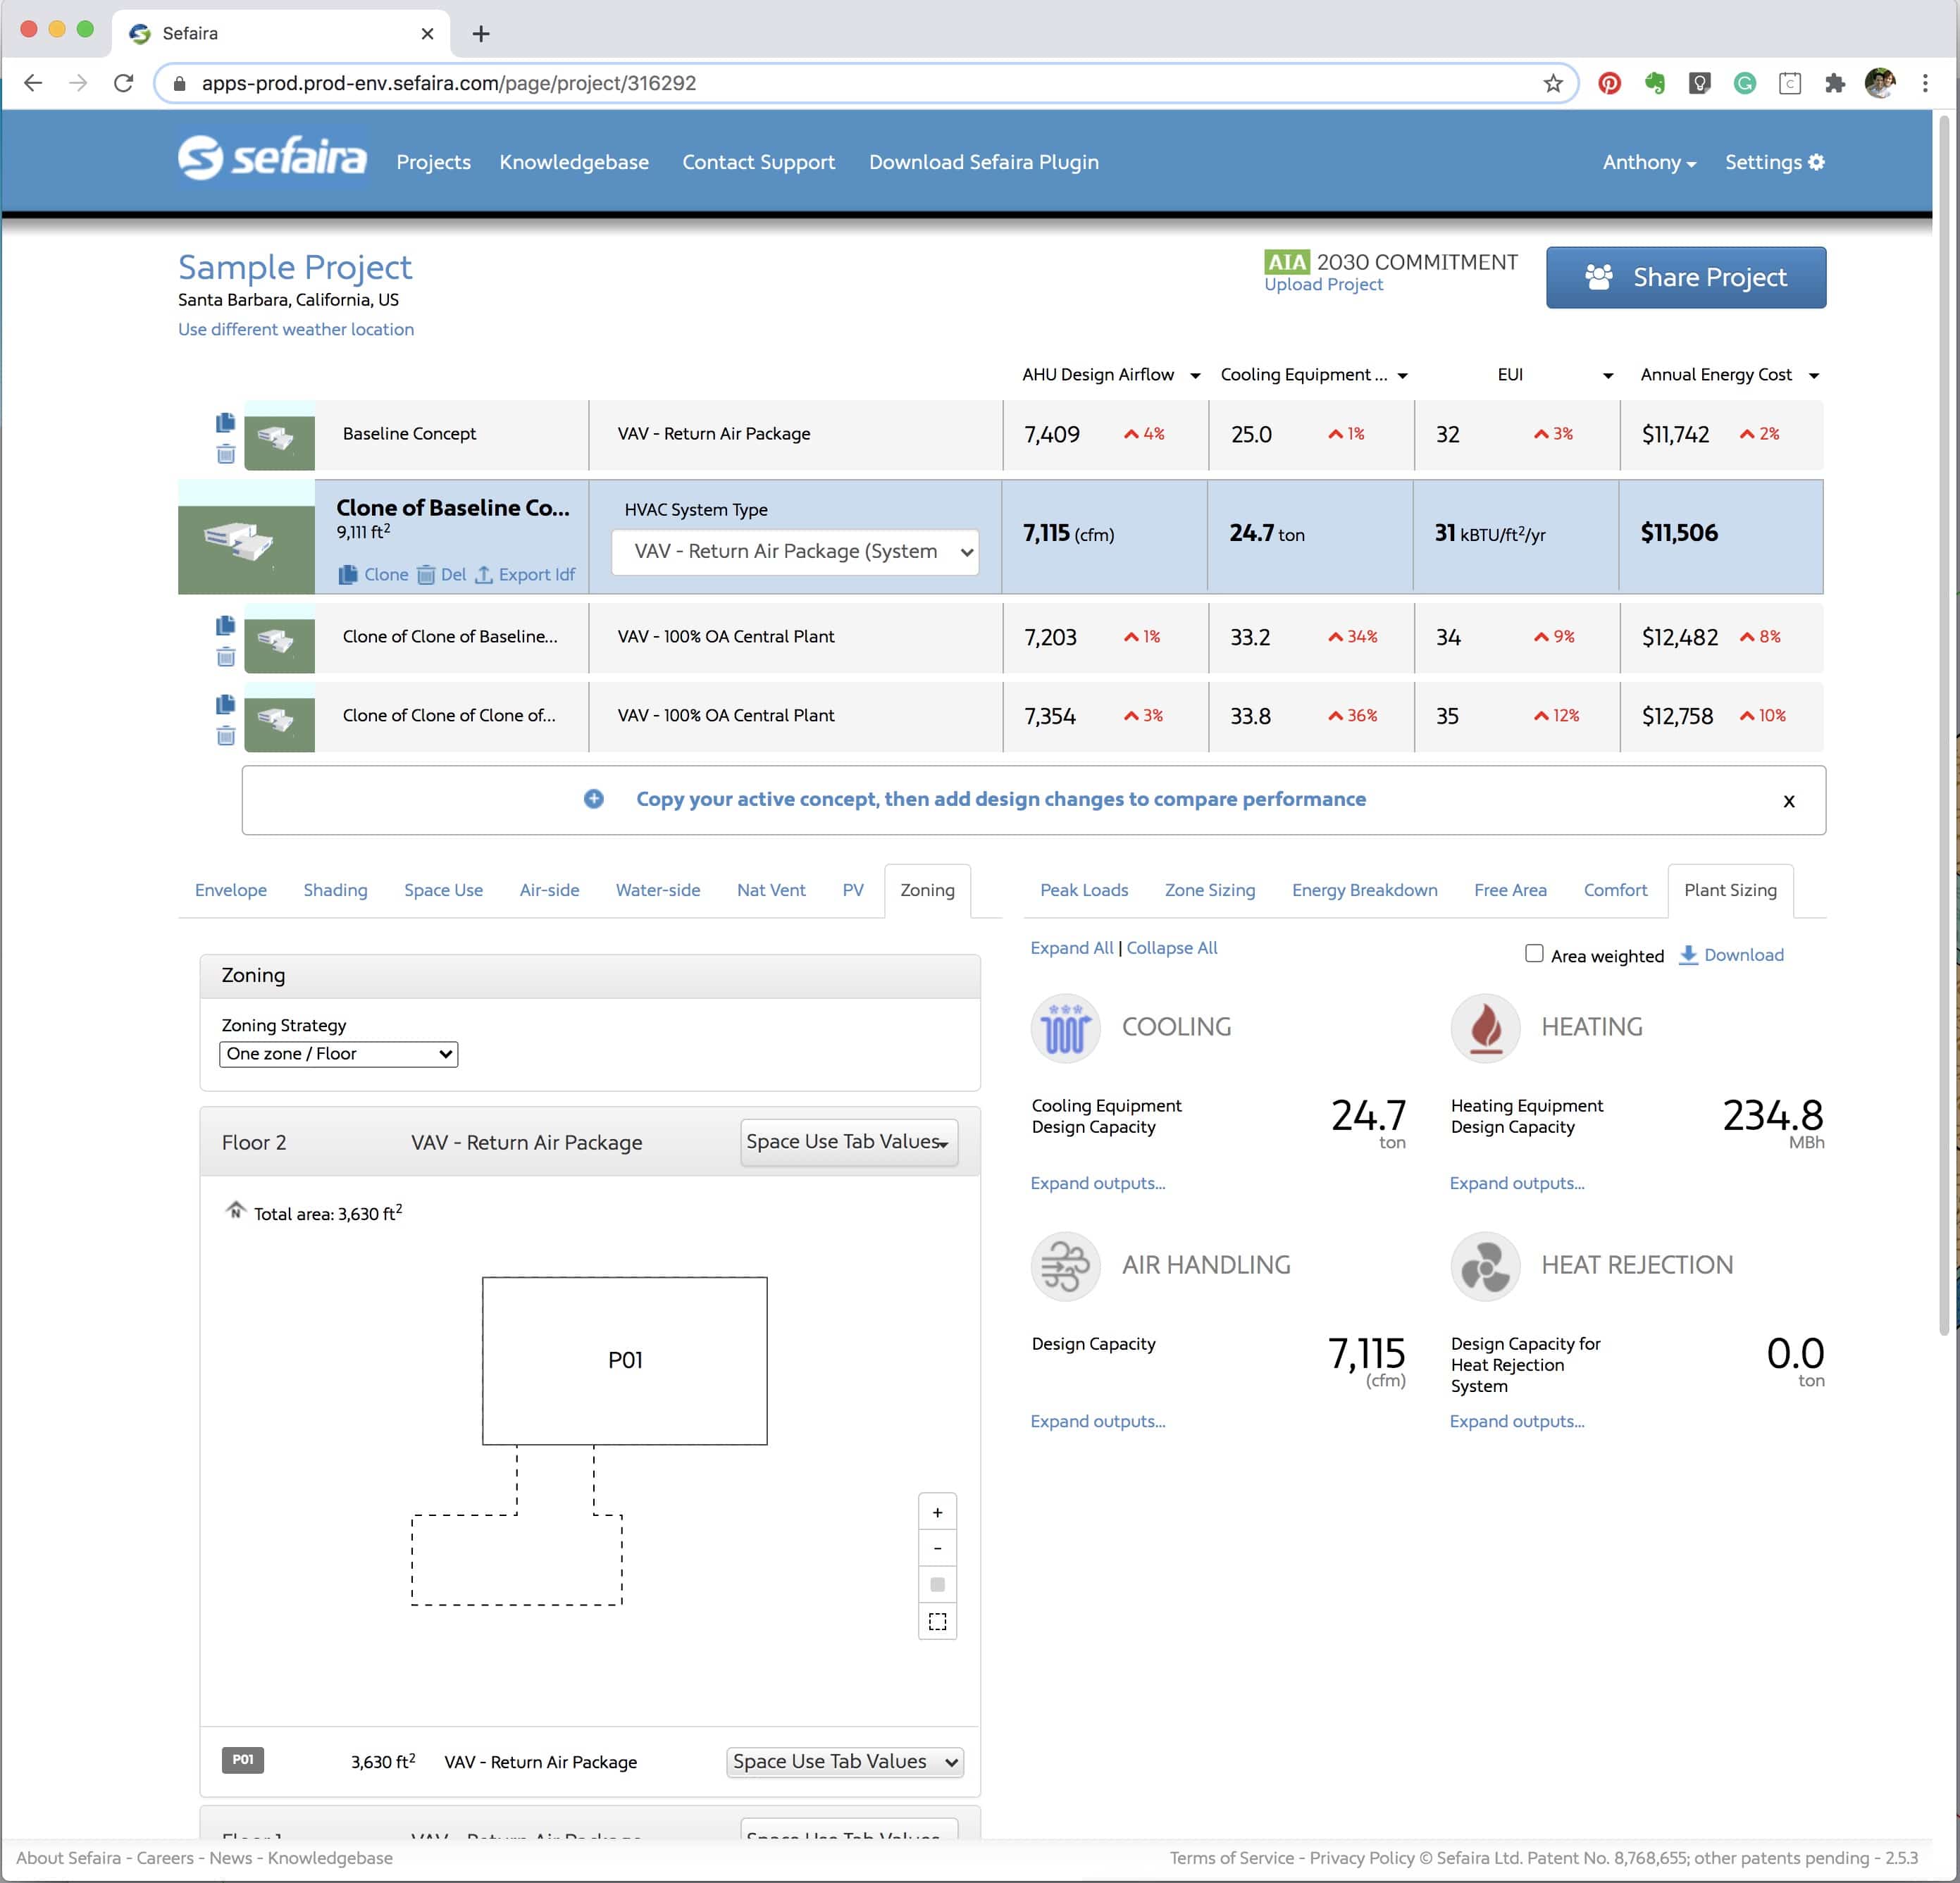
Sefaira Web App comes with SketchUp Studio and provides even more detailed information for energy and daylighting analysis. From within SketchUp Studio’s Sefaira interface, you push your model up into the cloud.
You are able to determine zoning strategies for HVAC. For example, the Baseline Concept used a perimeter/core zoning strategy. It’s annual energy costs were estimated at USD 11,742. Switching to a one zone per floor approach yielded a small savings at USD 11,506.
The Web app version of Sefaira is vastly more detailed and sophisticated and a discussion of its features is deserving of a separate article if not two or more. Perhaps Architosh will dive into that soon?
Energy Analysis
Back to the basics of Energy Analysis in the plugin. Running an Energy and Daylighting analysis yields analysis summary information in the Sefaira palette dashboard.
The performance dashboard is designed to give a quick overview of the energy and daylight performance of your building design. As you evolve your design you can rerun these analyses to improve the design and make your building more performant.
The Energy Use Intensity (EUI) dial measures the building’s annual energy use. If the building is performing well enough to meet the AIA 2030 Commitment it will say so in the UI and will be green. When it is failing it will say so and be red in color. The measurement is in BTU per square foot per year. My project is 20 thousand BTU per SF per year, under the 23 mark for the 2030 Commitment. The model properties are set at defaults but sliders enable adjustments. You can then re-run the analysis, post adjustments.
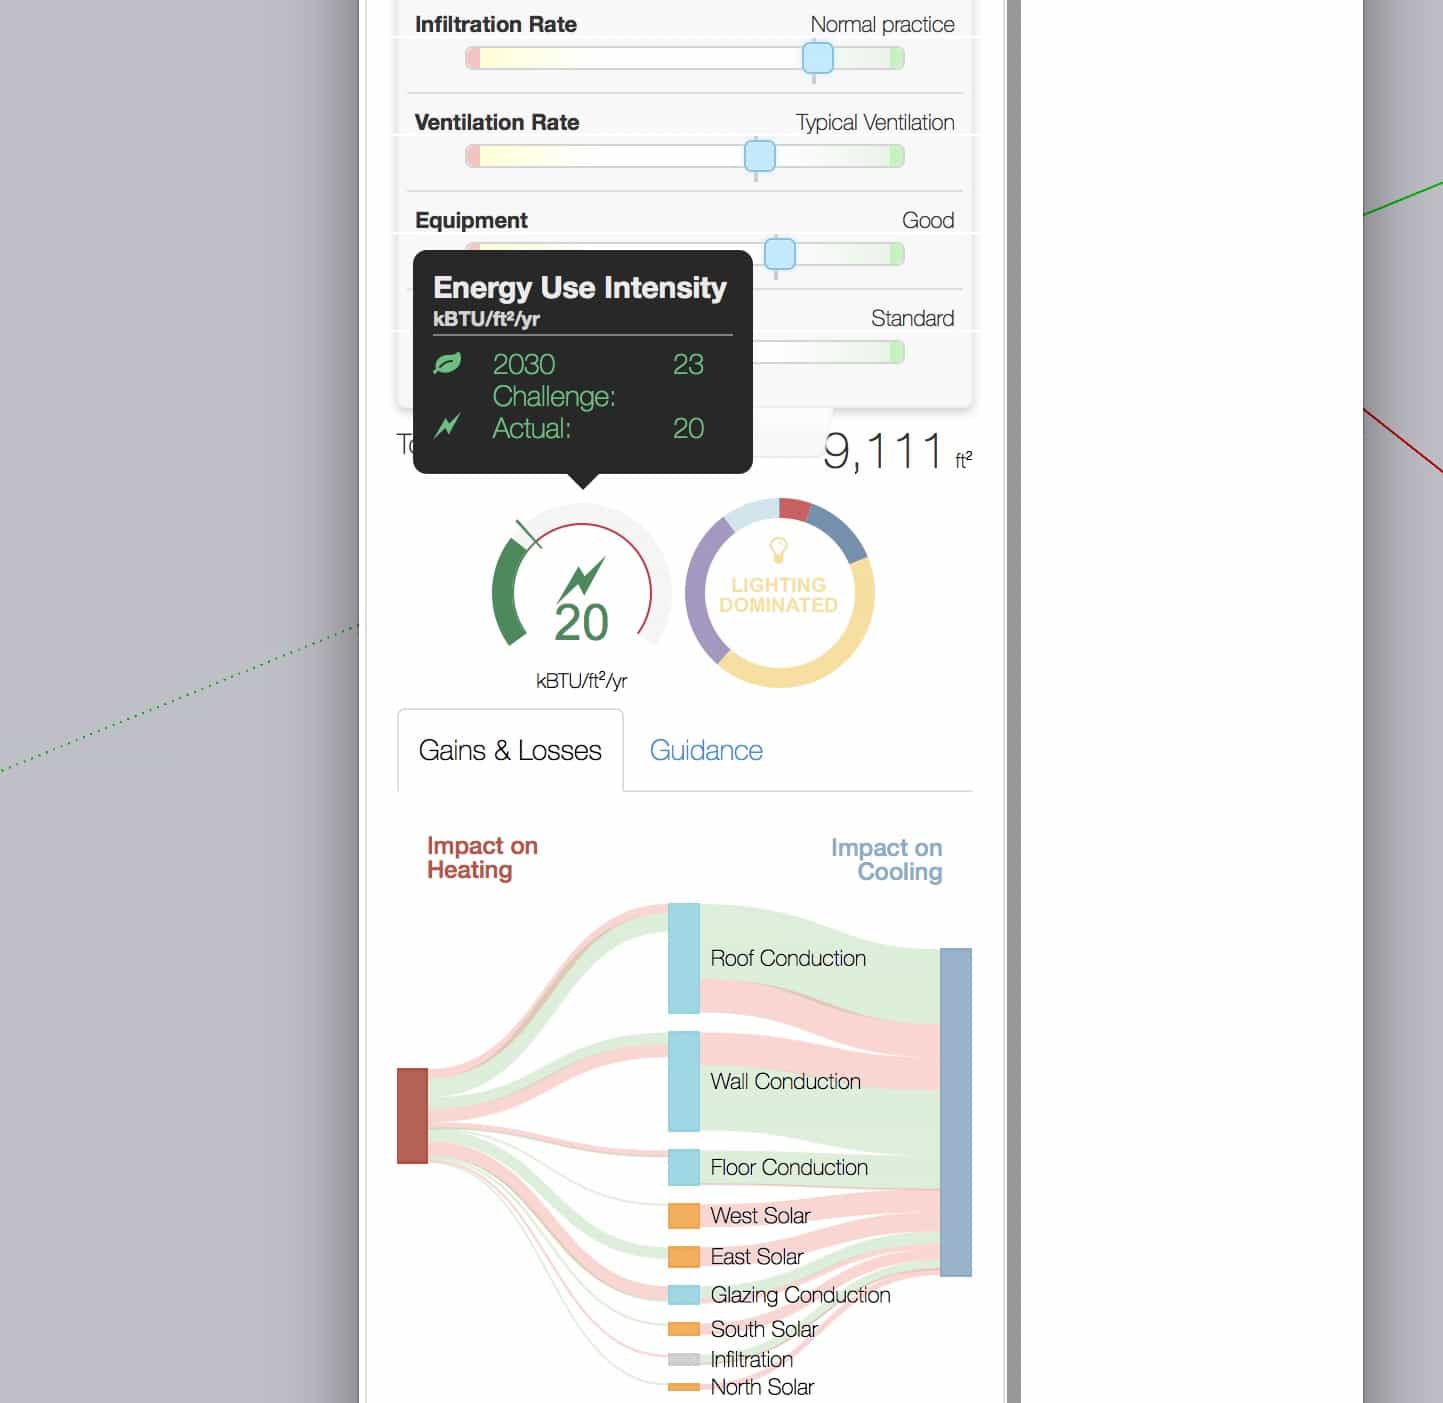
The performance dials give you a high-level overview and summary of energy and daylighting analysis. Clicking on the EUI dial tells me my project meets the AIA 2030 Challenge criteria.
The other dial is the energy segments dial. It breaks down the energy use into four areas: heating, cooling, equipment, and lighting. A lighting dominated project like mine shows up as noted “lighting dominated” as words in the center of the dial. Colored bars circling the dial indicate the other areas, including fans, pumps, and the four energy use areas just noted.
The third dial highlights your daylighting analysis results, color-coding the daily for the percentage of areas over lit, well lit, and under lit. The blue indicates spatial daylight autonomy, useful for LEED v4 daylighting analysis benchmarking, as discussed.
Putting it to Use
To make Sefaira work for your project you need just three data: (1) building use type, (2) location, and (3) properties. Properties include setting a standard baseline like ASHRAE 90.1 – 2019 or ASHRAE 90.1 – 2013, Part L – 2010, Part L – 2013 Notional or Default. I selected ASHRAE 90.1 – 2013.
You can make up your own baseline by using the sliders to change default values, like increasing insulation or your SHGC value for your glazing. You can also adjust your lighting standard.
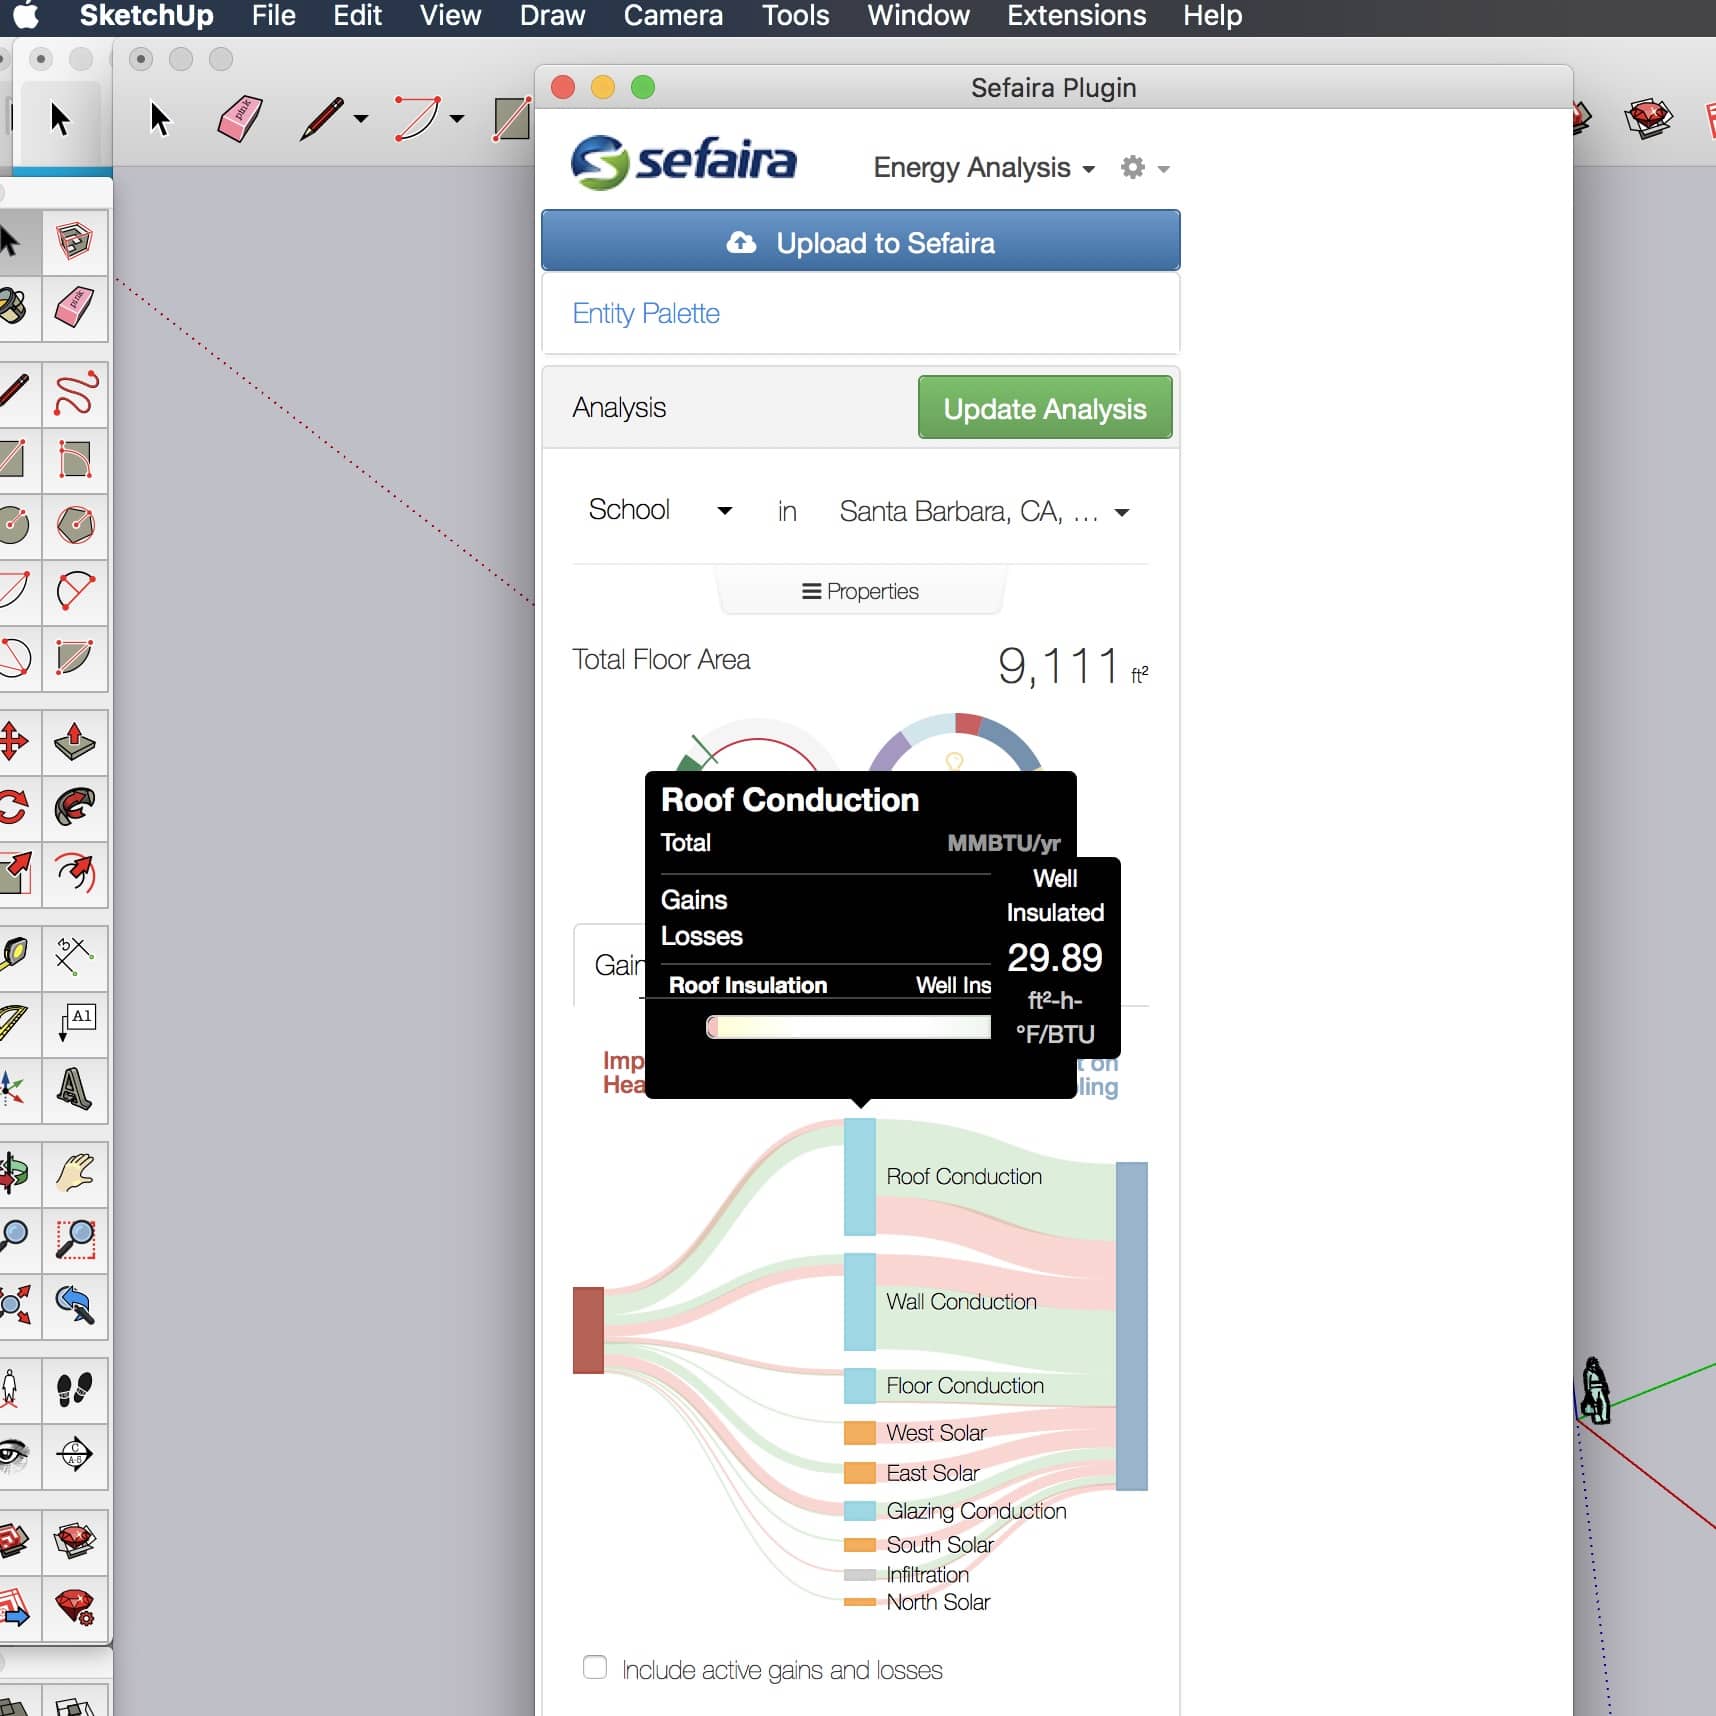
You can hover over the Gains & Losses diagram, clicking on it will result in a pop-up performance data with a slider for adjustment of values.
The Gains & Losses diagram indicates which building elements are responsible for heating and cooling loads. Red flows indicate negative (bad) contributions towards either the heating or cooling loads, while Green flows indicate positive (good) contributions.
If you hover of these loads you can see individual values. Clicking on them lets you adjust the values for that element. You then need to re-run the analysis to see this diagram change visually.
Final Comments
There is one final item I forgot to mention about SketchUp 2020 that is critical. Now when you use the Move tool to move a group or component you can now use the bounding box, including grip points (vertices) on the hidden side of the object. The group or component turns transparent (X-Ray) and enables visibility through the object.

You can now look through objects like groups and components and grab handles on the backsides of objects for model manipulation.
For example, I am able to locate a bed along a wall by finding its rear corner point along the headboard and locate it a set distance from the wall end. (see image above). Having access to this geometry which was previously hidden and not possible to grab is a new power feature for modeling and manipulating objects. The feature works with the Rotate tool as well.
Recommendations
In closing, the new reworking of the Layers palette (now called Tags) and Outliner are an awesome improvement. It means users have more structured control of their file and control over visibilities without having to create zillions of layers which are now called “tags.” There are some refinements still left to be had in Outliner, as was mentioned in this review. One thing not mentioned in the early part of this review is that you can simply drag items in the Outliner around to re-order the hierarchy of your model.
The most curious aspect of the Outliner’s new powers is its ability to work with hidden objects by tag. If something is invisible in the Tag palette, it still appears in the Outliner. That is new in 2020. You can also make groups invisible in Outliner but click on their nested components and see objects in that group in hidden wireframe mode. It’s a neat mode and one I kind of wish I could control more deliberately within the Outliner itself, on a per-item basis.
We primarily undertook this review to take an in-depth look at Sefaira tools that come with SketchUp Studio. We are deeply impressed with the integration of the Sefaira plugin overall. Sure, the Sefaira palette could be more intuitive but the help section for Sefaira more than makes up for it. What was a surprise was the Sefaira Web App integration giving users even deeper more specialized tools for energy analysis.
For architects who have always wondered about if SketchUp Studio, is worth the admission price. Architosh says “absolutely!” Just the daylighting analysis tools alone are very valuable for architectural design. With Sefaira inside SketchUp Studio, architects and designers can make critical early-phase design decisions based on analysis feedback, whether for daylighting, energy, or both and then make design adjustments and rerun analyses. — ANTHONY FRAUSTO-ROBLEDO, AIA, LEED AP
Pros: SketchUp Studio 2020 offers a powerful early phase energy and daylighting toolset in the Sefaira plugin extension for SketchUp and its adjoining web app. Sefaira’s tools work seamlessly with SketchUp with few exceptions. The new Outliner and Tag palette renaming make SketchUp 2020 a more capable and professional 3D modeler from the point of view of model and scene structure and organization. There is still more to do here but this is a very good big step in the right direction. The other feature that all SketchUp users, novice and pro, will appreciate is the ability to see through groups and components when moving or rotating them and to grab the backside of objects at key control points for move or rotation operations.
Cons: There are few cons in SketchUp Studio 2020 and this review was really an introduction for the Architosh audience to Studio, in general. IFC schema is still stuck at IFC 2×3; there is no support for IFC 4. There is also no BCF (BIM Collaborative Format) file support, though IFC import and export is fully there. We hesitate to say more about BIM and SketchUp at this time, as it is subject unto itself. We made several suggestions in this review, but none of them are really cons in my view.
Advice: For architects and designers who use SketchUp often in their practices, SketchUp Studio 2020 with Sefaira is both approachable and immensely useful to design. It will help you think more deeply about daylight in your buildings as well as provide you tools useful to the LEED process as well as in-depth energy analysis workflows.
![]()