GRAPHISOFT introduced version 20—the latest version of its industry-leading BIM application—back in 2016 and we wrote about it in a major feature here. However, in this review type feature we take a ‘deep dive’ into the three top focus areas in version 20: (1) the new user interface, (2) graphic overrides, and (3) the “I” in BIM.
The goal of digging deeper should be obvious. We discover, for example, the edge of functionality with the new graphic overrides technology, but the BIM pioneer—always thinking ahead—provided the not-so-obvious answer to addressing ways to get beyond this edge.
It is safe to say that the link between graphic overrides and the effort to put the “I” in BIM runs deep in this release. But it is just as safe to say that this technology is foundational to progress that will be made in years to come. With that point in mind, the new UI update is appropriately timed.
User Interface Changes—Small Things That Are Big
The user interface update in version 20 is one of the biggest new changes. At first, it may seem just cosmetic because overall the UI design is essentially the same. I recall an interview discussion with Viktor Varkonyi, CEO of GRAPHISOFT, about why he said you can’t just radically change a user-interface in a program like a BIM tool. It boils down to not disorienting your existing user base.
So what are the new UI changes about if things are essentially the same and not disorienting to existing users?
Visual Design
The answer falls into two logical buckets. The first is visual design. A new “flat” look permeates the new version, a look that reflects modern or current UI design preferences, embodied both out on the web, in mobile apps, and—principally for the Hungarian software company—in Apple’s iOS and macOS operating systems. It is an obvious nod to younger generations coming up in the industry who are more mobile device centric technology users than the Boomer generation or even Gen-X architects in the industry.
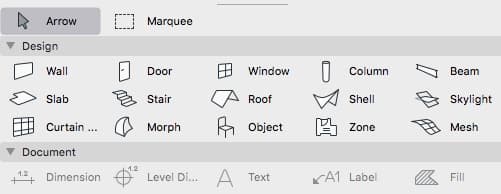
01 – The toolbar icons embody the essence of the new “flat look” in ARCHICAD 20’s new UI.
There are a few more things that should be said about this new flatness look. Things are substantially cleaned up and although the icons and graphics behind the UI are now based on scalable vector graphics (.svg), a perhaps “heavier” file format, the stripped back look speaks to a truth that every CAD/BIM vendor should be extolling—your users demand speed, so keep things light weight. (image 01)
Some graphic highlights worth mentioning about the new UI include the user of Helvetica Neue and San Fransico fonts for macOS users) and for all users more space between items in palettes, larger icons, and some use of all bold lettering in panel titles.
Functions
The new user-interface carries substantial functional user-interaction (UX) changes, though admittedly most of this operates at a subtle but powerful level. Take for example the ability to transfer view settings from one tab to another tab through the new Inject View Settings command. (see image 02)
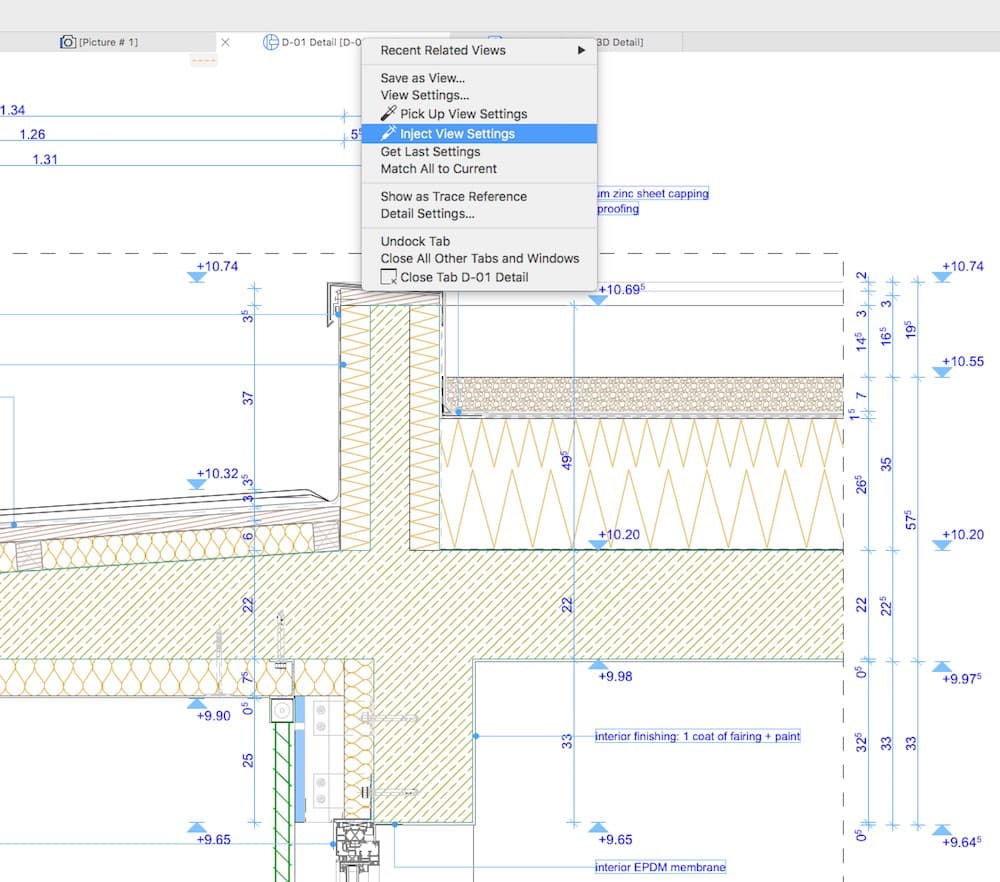
02 – View properties are now transferred from tab to tab through new menu options via right-clicking on tabs themselves.
Another powerful, subtle change is the dynamic nature of UI panels. When you widen the main viewport window, the left-sided Toolbar dynamically reconfigures between icon only mode and icon with text mode views. The Info Box above, also cleaned up, intelligently eliminates items like the scroll bar first, then the panel headers but with the scrollbars back, then the scroll bars and panel headers.
The new Quick Options Bar at the bottom is a big change as well—with a streamlined set of options. Notable improvements include the way functions like zoom and orbit buttons appear and change based on the nature of what type of view is active, in a particular tab. In 2D only views, you get Previous Zoom, Next Zoom, and Increase Zoom tools and Fit to Window—and just these. In 3D views you gain Orbit and 3D Explore. (see image 03)

03 – Intelligent UI palettes automatically reconfigure, and new expandable options enable ultra-wide working conditions in the main viewport window. You can see the new Quick Options Bar by clicking on the image above and viewing the items at the bottom.
The new Graphics Overrides features are accessible in a popup on the new Quick Options Bar. This means no matter what view you are on, you can turn a graphic override on and make it active for that view. (More on Graphic Overrides in a moment).
The tabs features are also improved. Firstly, moving from tab to tab no longer transfers the view settings from the first active tab to the next tab automatically. Each view maintains its view setting properties. You can now “pick up” a particular tab’s view settings by right-clicking PickUp View Settings and then use the new Inject View Settings feature on another tab.
These are just some of the new functional improvements related to the new UI. But before we leave this topic one more is really worth mentioning. Many of the palettes now have automatic vertical height adjustment. For example, the Navigator palette expands and contracts vertically based on items under each category. But an extra cool new feature is how under Settings dialogs panel titles collapse and expand automatically in order to make panel contents visible somewhere in the middle of the dialog itself. So there is never any need for a vertical scrollbar for a dialog.
next page: New Graphic Overrides—Visualizing Building Data Differently
New Graphic Overrides—Visualizing Building Data Differently
The new Graphic Overrides Combinations is a visual way to apply wholesale changes to the appearance of 2D and 3D views of the BIM model without changing default visual appearances of elements set in pen color, line type, thickness, fills, surfaces, etc. When you apply a graphic override combination to a view the drawing view or 3D model view visually changes, inheriting a graphics recipe of sorts. (see images 04 – 08)
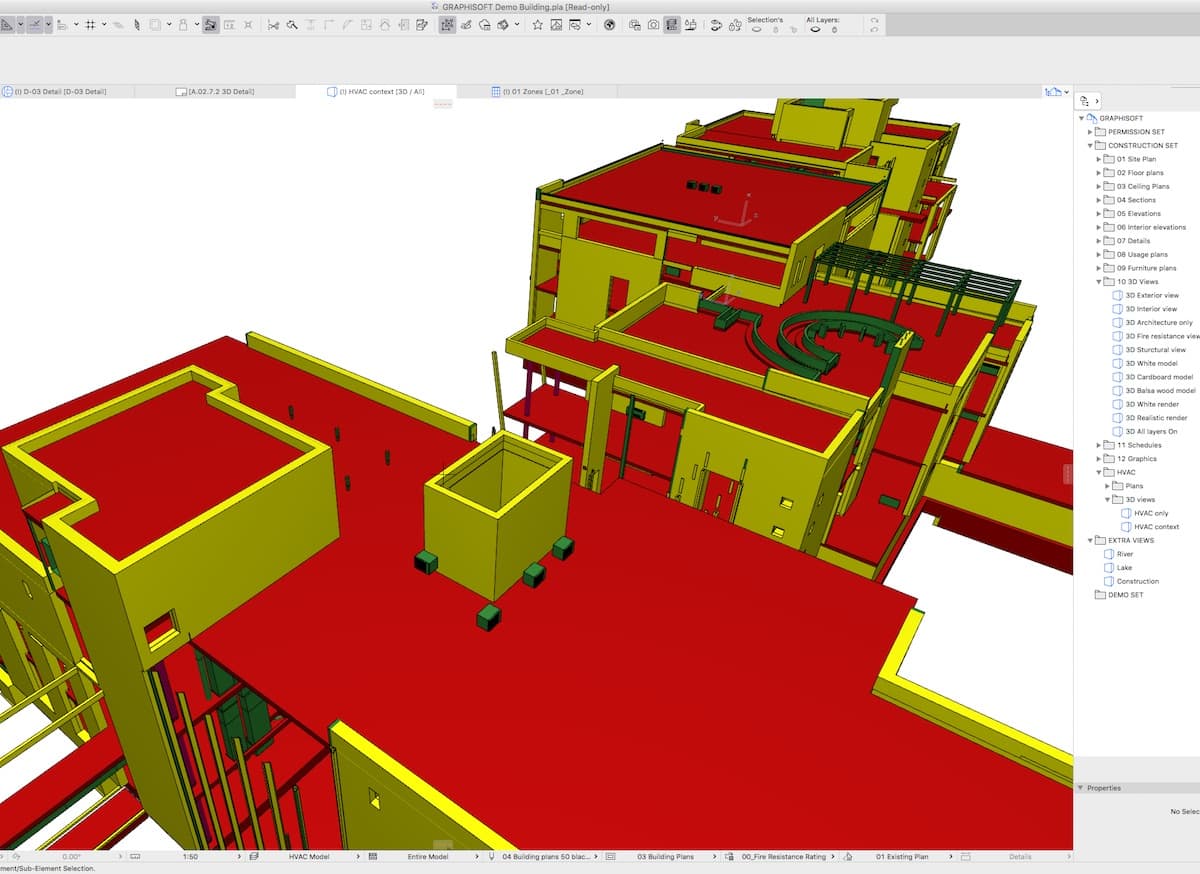
04 – New Graphic Overrides can alter the appearance of BIM model elements based on criteria met rules. In this example, colors denote fire resistance measured in minutes (eg: 60, 90 min., etc).
Graphic overrides are useful for several different purposes. On obvious one is purely visual and appearance oriented. A default white-model graphic override can change the entire BIM model to just white. Another one changes the BIM model to balsa wood or cardboard. (see images 05- 07) And you can make “x-ray” type transparent views into the model leaving certain elements solid and in bright colors to visually isolate them for multiple purposes. (see image 07)
Using Graphic overrides one can set up rules—when various elements in the BIM model or data meet certain criteria—a graphic override (appearance setting) can be applied to just those elements.
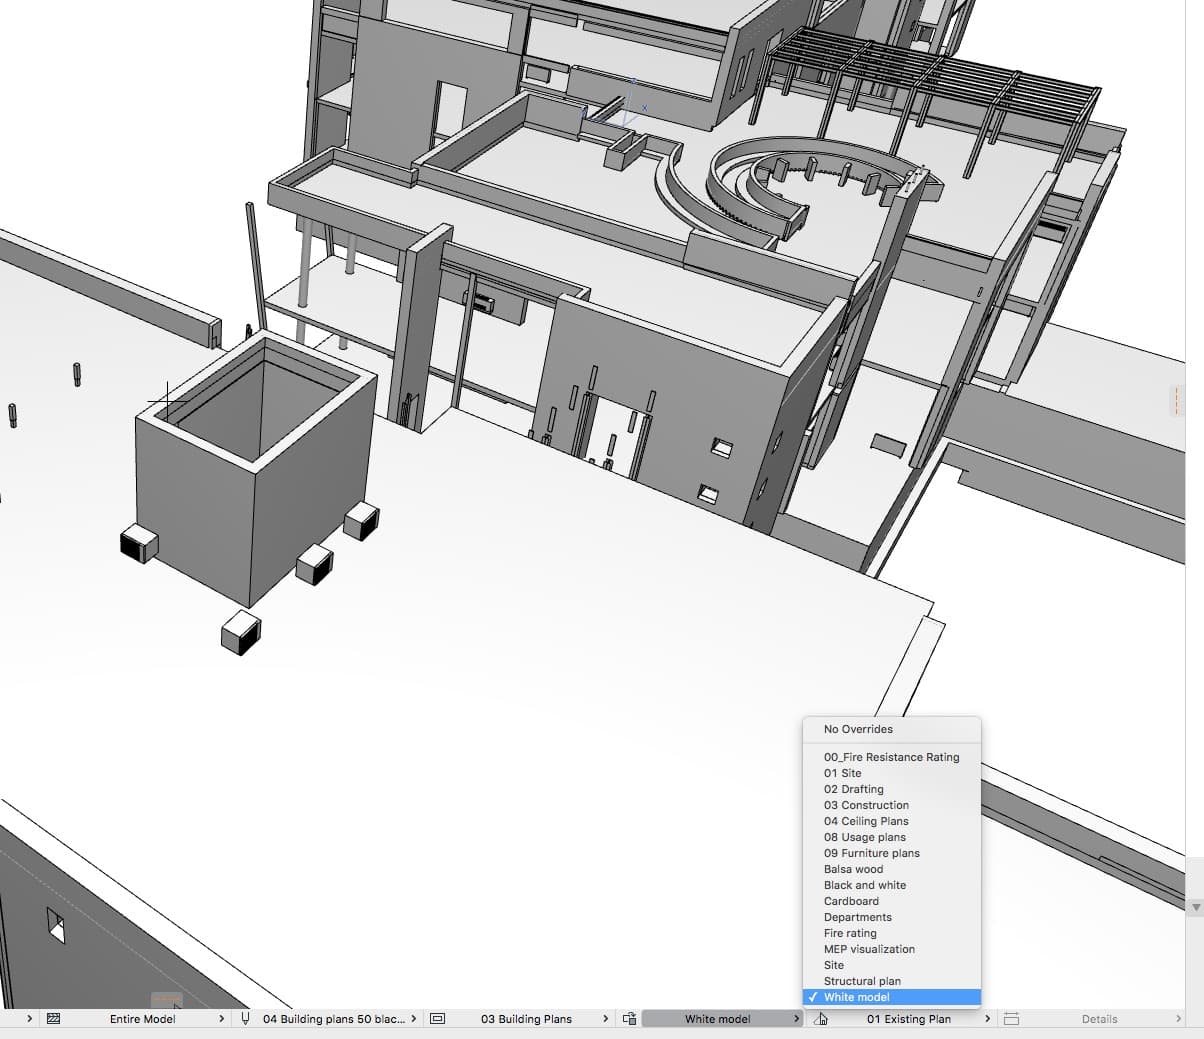
05 – One default overlay is White model, turning the entire BIM model into something visually simple.
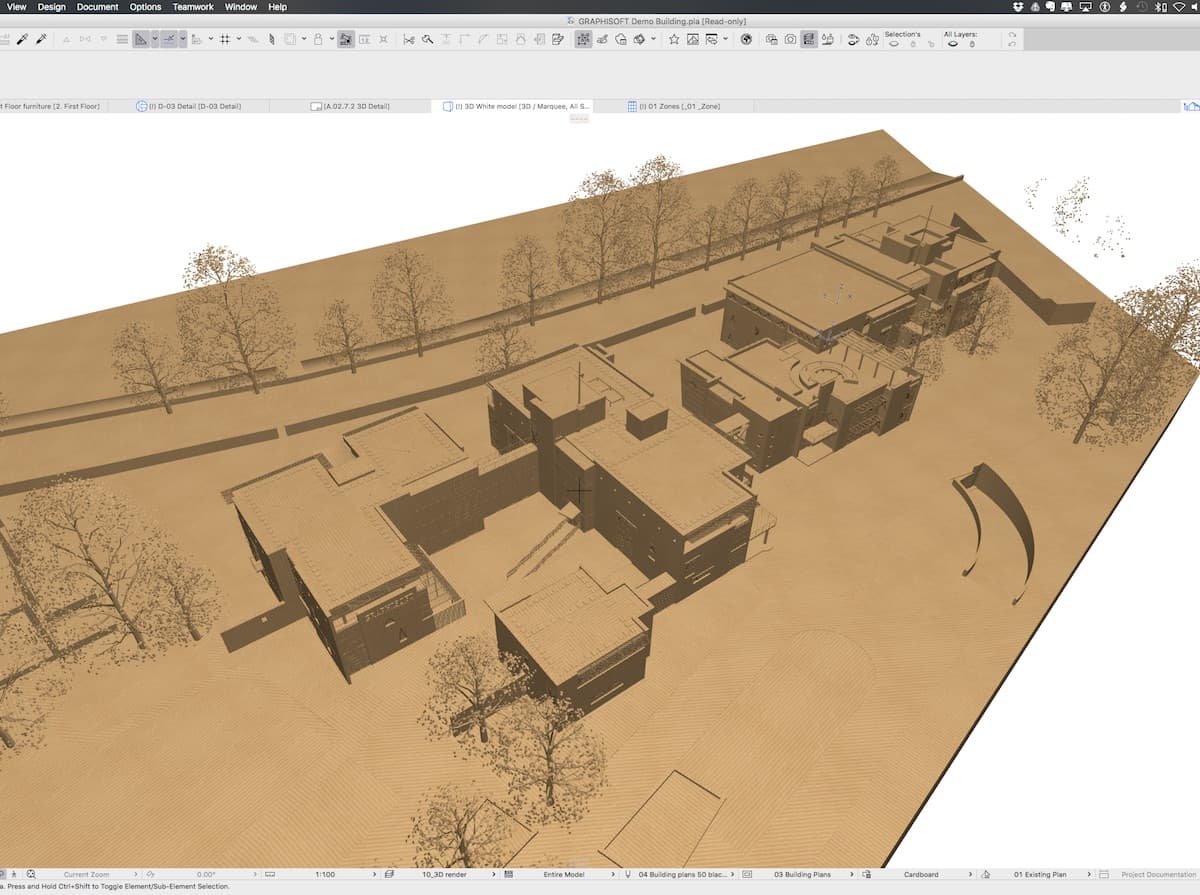
06 – Another view with the graphic override Cardboard applied.
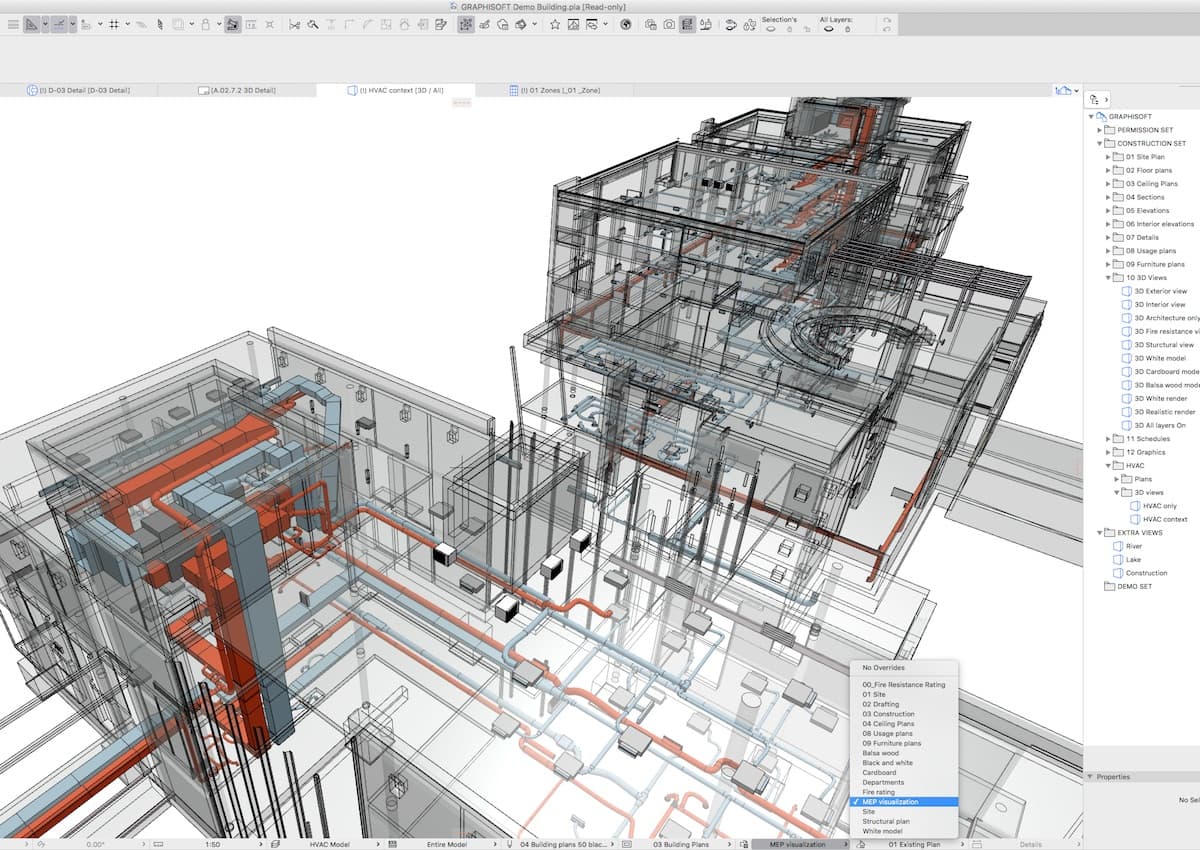
07- An overlay view can isolate particular elements in the BIM model, like the mechanical ductwork.
For example, one can set up a fire resistance rating graphic override, which quickly turns the model into an instance graphic representation that delineates which elements are fire-rated for say 60, 90, or 120 minutes, etc. Each criterion can get its own color, for example, to delineate the rating level. (see image 04)
Another example is to turn nearly all elements of the BIM geometry transparent except the mechanical model elements, thereby enabling an x-ray type view of the BIM model with a highlighted focus on ductwork. (see image 07) Other examples include making graphic overrides for views that highlight various departments in a building, or sound transmission criteria in building components. The possibilities are quite endless.
A Sample Run Through
So how easy or fast is it to do this? Let’s walk through an example, from scratch.
In the image below I created a new graphic override combination called Aluminum vs Steel. (image 08) You first open the Graphic Overrides Combinations dialog. (see image 09 below) On the left are previously saved or default override combinations. I then hit the New button and create three graphic override rules.
One rule will be the rule that finds all materials that are made out of aluminum, the second rule finds all materials that are made out of steel, and the third rule finds all elements in the BIM model and turns them transparent as shown.
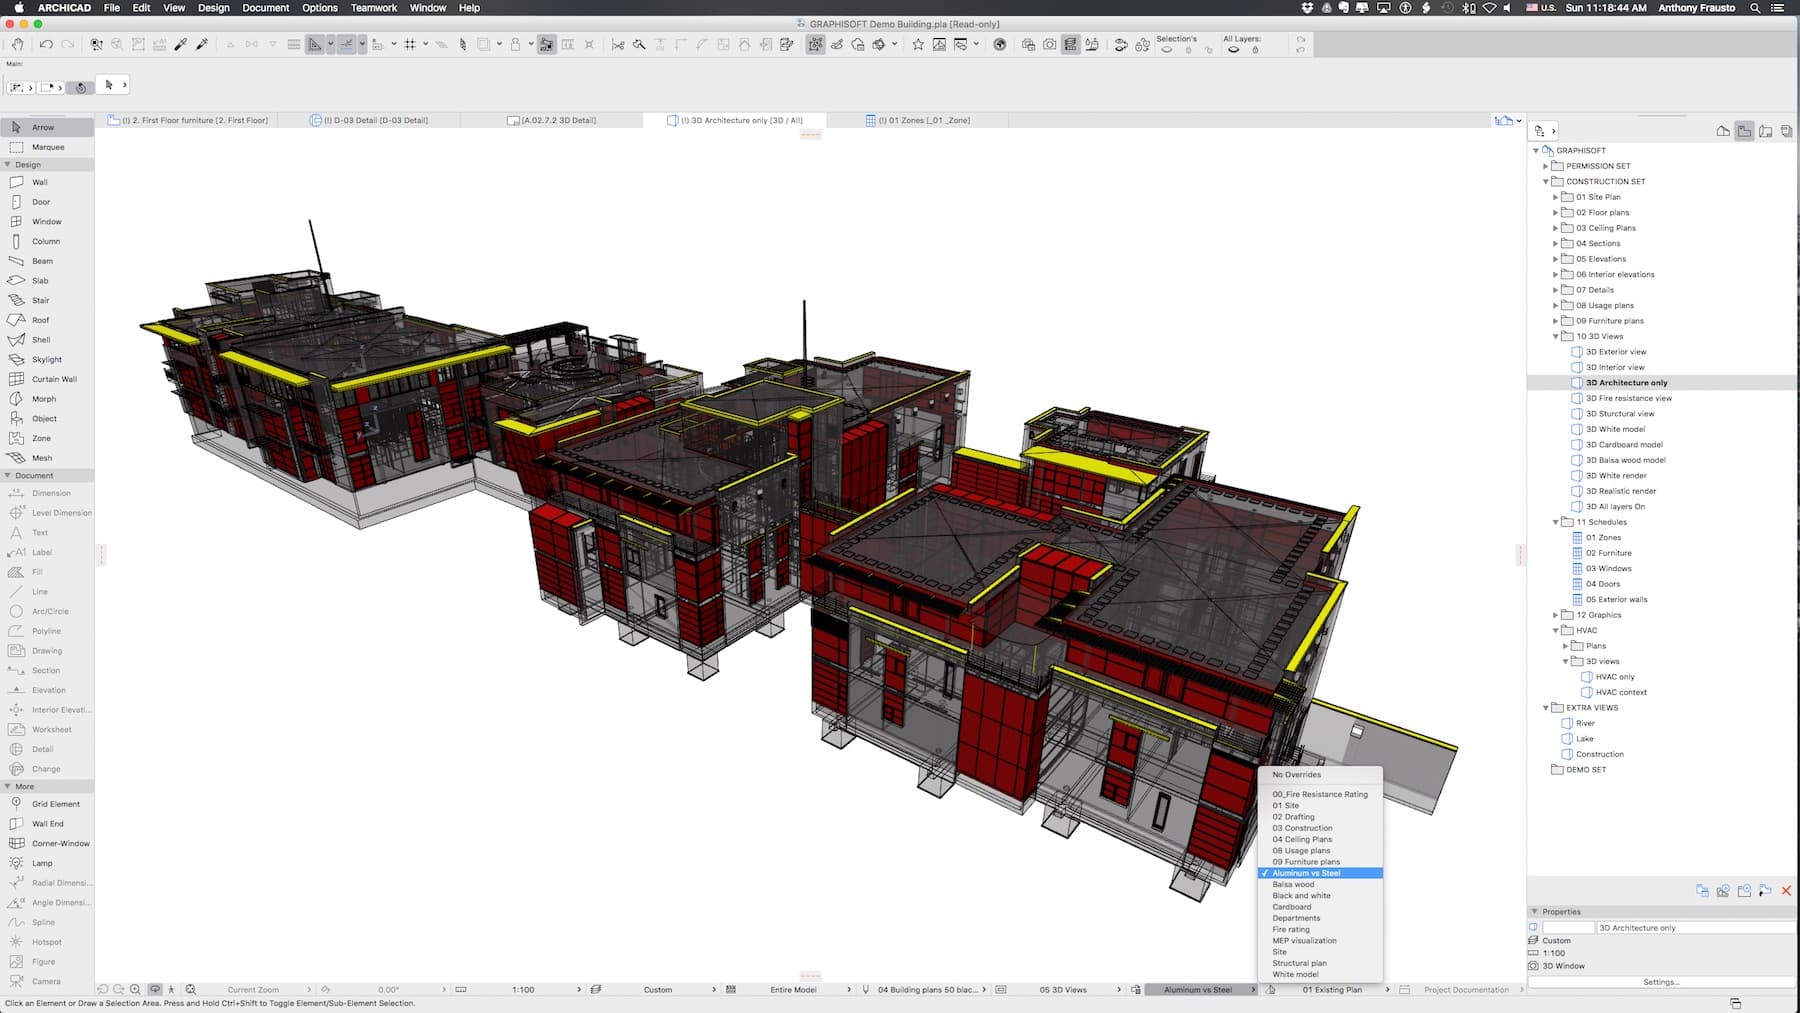
08 – I created a new graphic override called Aluminum vs Steel.
In creating that third rule I defined Criteria such that an Element Type “is” (a value equal to) “All Types” and thereby every element in the BIM model (eg: walls, slabs, roofs, doors, etc) is included in the rule. As you can see from below (image 10) I had lots of options besides “All Types” (eg: including things beyond model geometry like text, labels, fills, dimensions, markers, etc) to choose from.
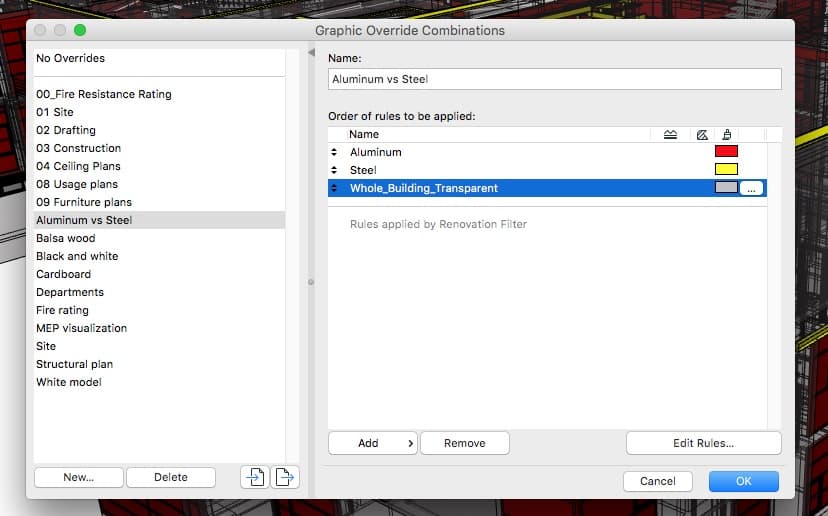
09 – The Graphic Override Combinations dialog shows the creation of my new rule.
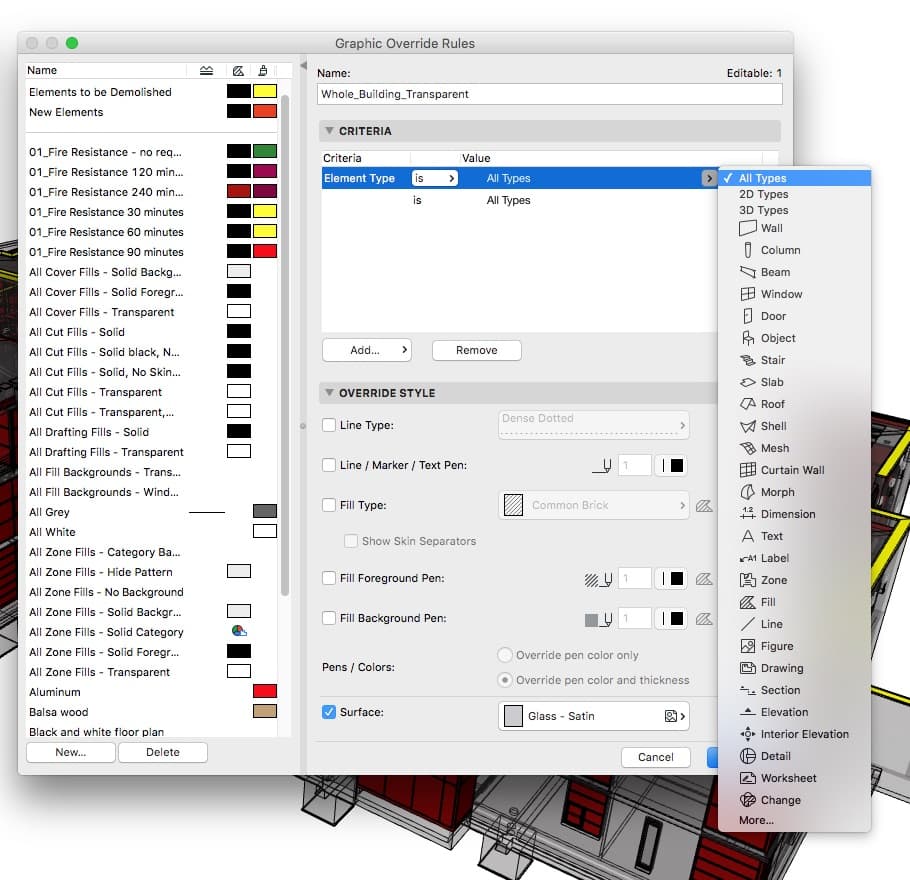
10 – You can see the selection editing of this particular rule.
My override style changes simply select Surface and then select “Glass-Satin” as my surface material choice. This rule alone turns the whole building transparent by rendering everything like it was transparent glass (OpenGL level of rendering quality).
Next, I created two more rules and chose Building Material as my criteria and from the drop-down menu selected “Aluminum.” I repeated the rule and selected “Aluminum Panels.” The graphical override applied to aluminum was a red color (no transparency). I repeated this process for steel as a material in the project using a yellow color.
Now I can apply the saved Aluminum vs Steel Overrides Combination to the viewport by clicking the OK button in the dialog. (see images 10) The BIM model view now shows steel (yellow) and aluminum (red) elements shown against a transparent view of the whole building with edge lines on. This x-ray type view, highlighting a specific feature of the structure, can be useful for various reasons—illustrative and for identification purposes. In some ways, it can function as a model checker.
Elements and Parameters
When I was first introduced to the new overrides capabilities in version 20 last year, the example I saw was similar to the one I just went through, except it visually identified doors that did not meet handicap access requirements.
Graphic override rules can be implemented on various parameters used as criteria. In general, they are applicable for new properties only and some generic ARCHICAD parameters such as height and widths of an element. That is why a rule can find a door of a particular width and determine if it meets a criterion.
The list of parameters available to criteria is shown in the next image. (image 11)
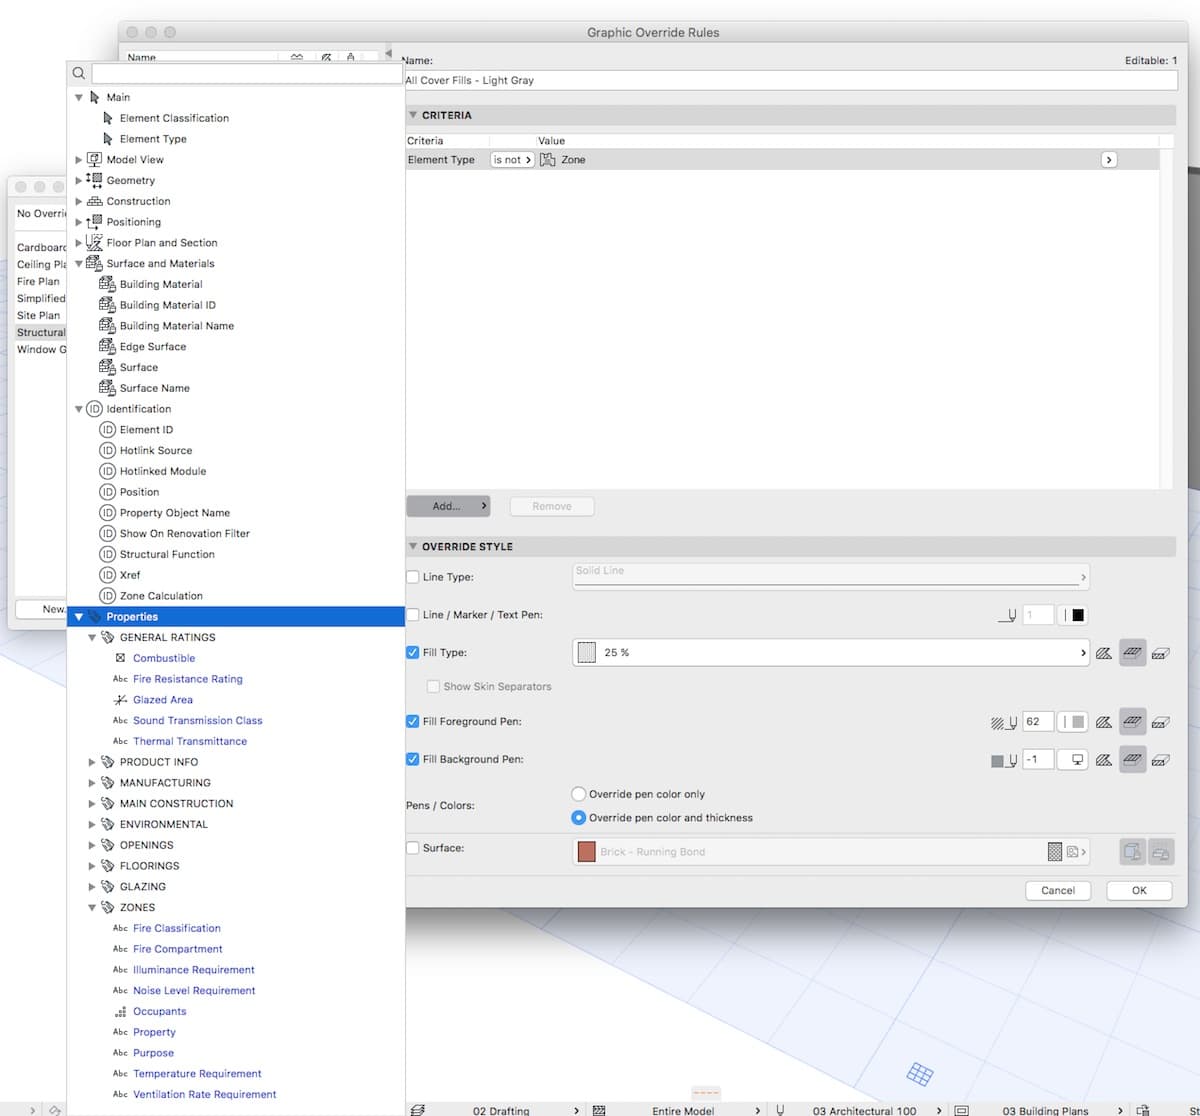
11_This view shows the available criteria for rules in graphic overrides.
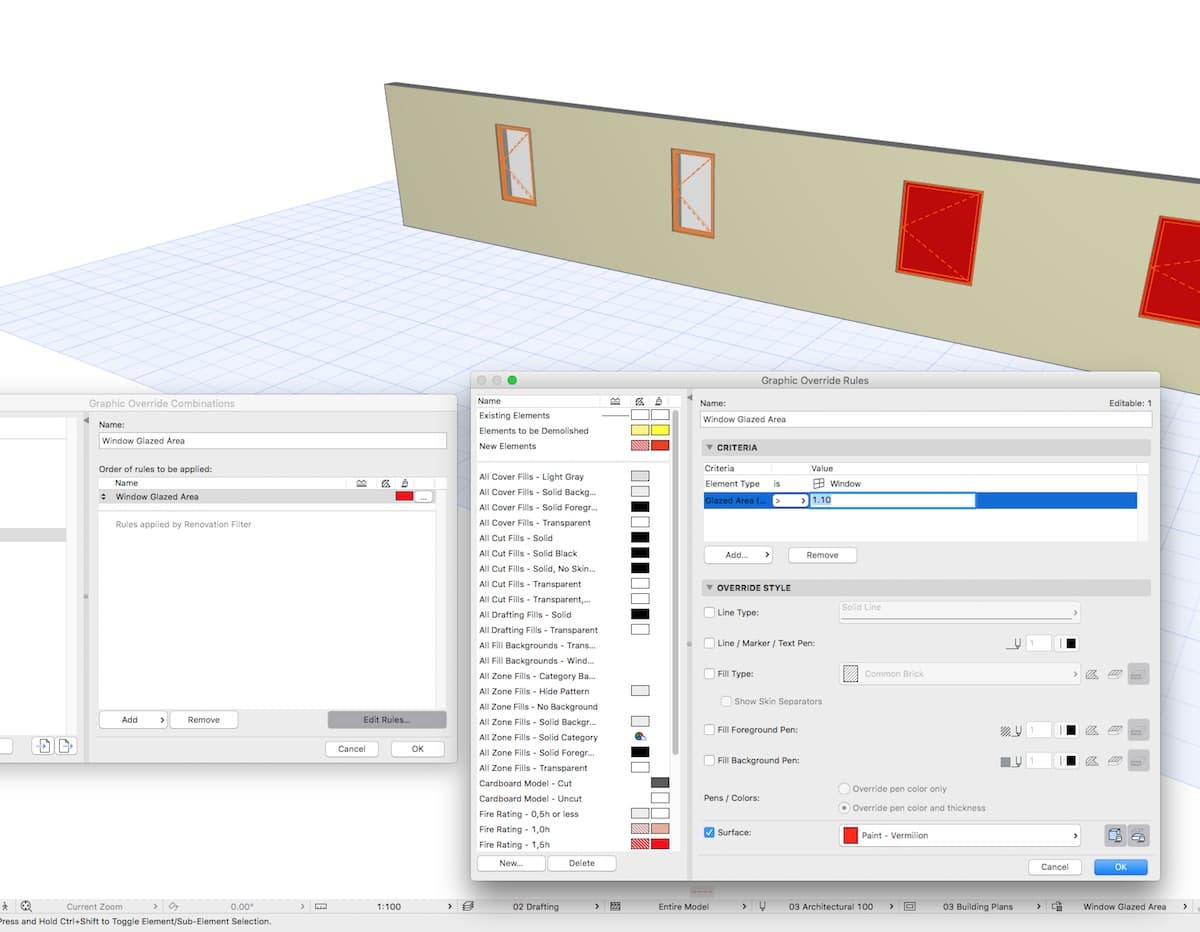
12 – A custom property field can be established for any element in the BIM model and this field’s data can be used for matching criteria in a new rule.
While this list is extensive, there are some data inside ARCHICAD elements which are stored as a GDL parameter. For example, the area of a piece of glazing in a curtain wall or window is stored as GDL data. This type of data is not yet accessible to criteria for the Graphic Override Rules. What do you do then if you run into this as an issue?
In the case of this glazing example, you assign a new property (eg: window glazing area) to your fenestration units and import glazing area values from manufacturer data sheets using the Excel data import capabilities. Or you can simply fill this data in manually. (see image 12 above and image 17)
next page: Getting to Data—The “I” in BIM
Getting to Data—The “I” in BIM
The third major new feature in ARCHICAD 20 is the new focus on information in BIM models. Central to this focus is the new Property Manager dialog. (image 13) You access this new dialog from the Option menu. The data you enter into the Property Manager is nongeometrical, meaning it doesn’t represent the data that defines the 3D geometry model. It can, however, reflect some aspects of the numerical data behind the 3D geometry model.
Version 20’s new import/export commands facilitate one way of entering such data, in a semi-automatic way. The other way is to manually enter the data in the Property Manager as default values and changeable or selectable values by manual entry. That, however, is not what you ideally want to do. GRAPHISOFT advocates creating the property categories, exporting the data out as Excel spreadsheets, and then round-tripping that data back into ARCHICAD.
This workflow is recommended in the case where data providers (eg: manufacturers) are not able to contribute to the BIM model directly. Consultants too may not be able to contribute directly to the BIM model but may generate key data for the project.
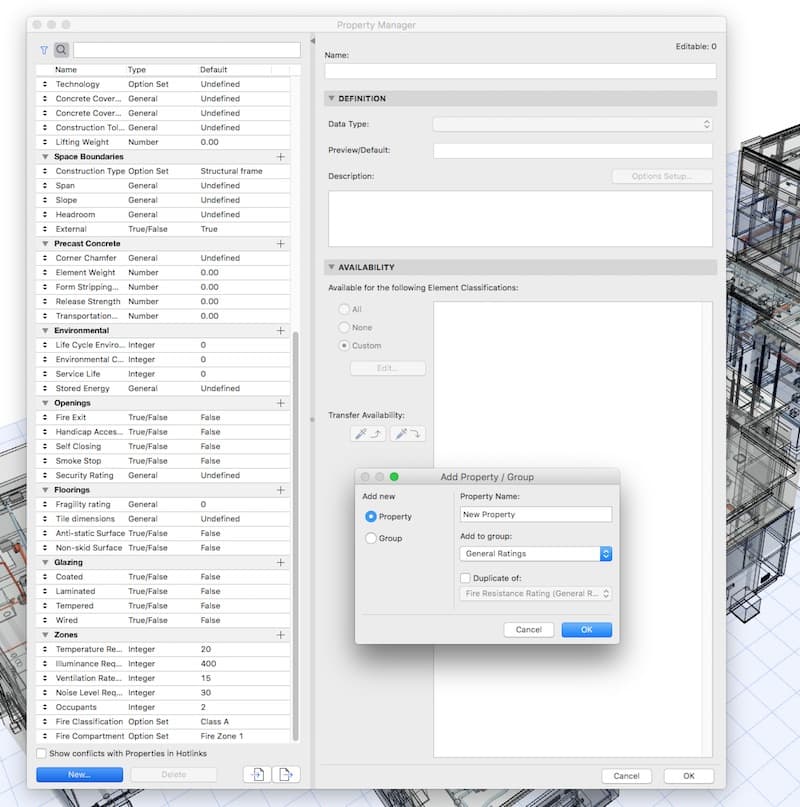
13 – The new Property Manager in version 20 enables the custom input of BIM data.
For example, a fenestration or facade consultant may work with an architect and load into Excel spreadsheets detailed data, including performance data, about the elements of a curtain wall system that is not handled as an entire BIM model by a manufacturer. A hardware consultant may do a similar job for the doors within a project inputting extensive hardware information.
The Property Manager Dialog
The new Property Manager dialog is the heart of all these new capabilities with information. It is here that you create, add, delete, and define “properties” for BIM elements that go beyond their core geometry data and beyond their BIM and ARCHICAD-centric definitions (eg: element type = wall).
As you can see from the picture above (image 13), certain category groups are setup by default. General Ratings is a particularly valuable one that can be added to. One can also simply edit a given property by modifying its “data type” and “parameters” (ie: values). If we wanted to modify the property Fire Resistance Rating we could select a different ‘data type’ to use. (image 14 – 15)
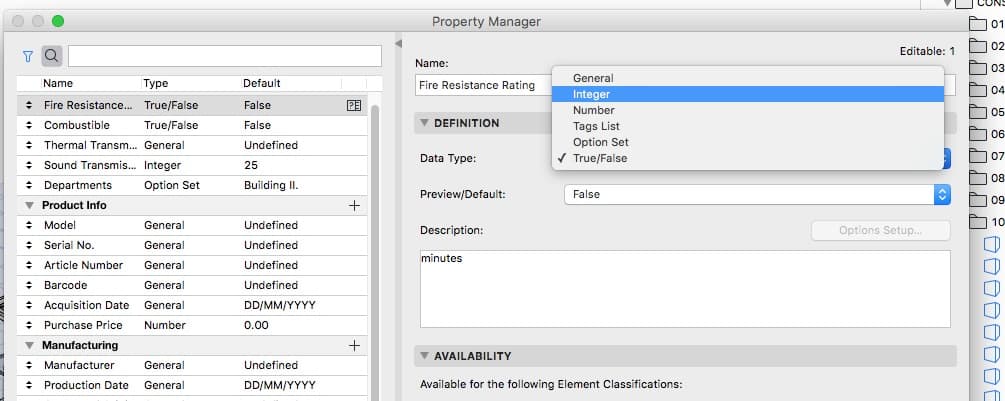
14 – Editing a specific property in the Property Manager.
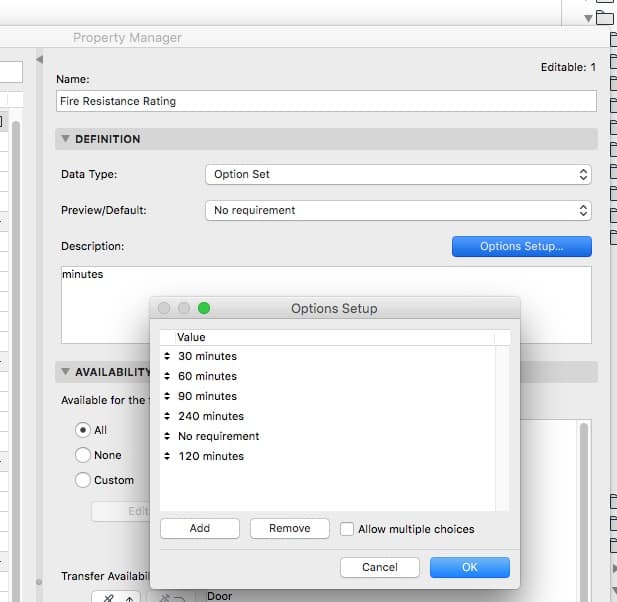
15 – The property Fire Resistance Rating is set to work with an Option Set.
For Fire Resistance Rating the default sets the data type to “Option Set”—a choice that means the user selects a value from a drop-down menu. But it could also be a number, an integer, a tag, or true/false.
Earlier it was noted that GDL data, such as the volume or area of a particular element in the BIM geometry model, wasn’t accessible to criteria fitting in the graphic override rules. In a specific case, we added a property called “Glazed Area” via the Property Manager. (image 16 below) But once data is inside the Property Manager graphic override rule can query against to see if it meets specific criteria.
Properties and Settings Dialogs
The default set of properties found in the new Property Manager span the gamut across category groups—such as Glazing, Zones, Openings, Environmental, Ratings, Space Boundaries, etc. The user can modify, add, delete properties as well as do the same for groups of properties.
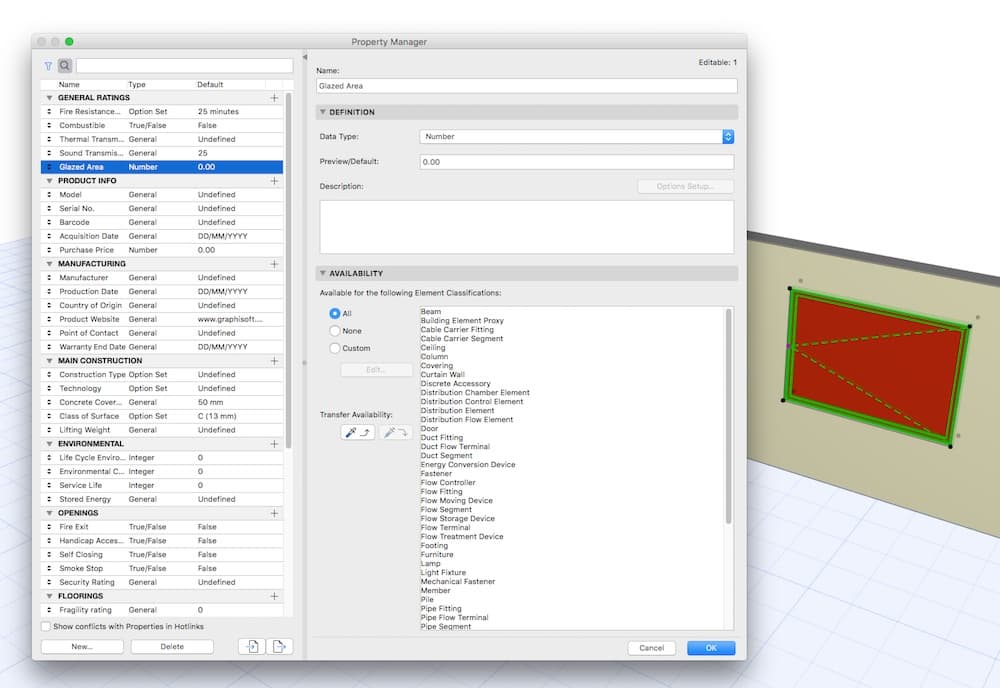
16 – Adding a new property called Glazing Area within the Property Manager.
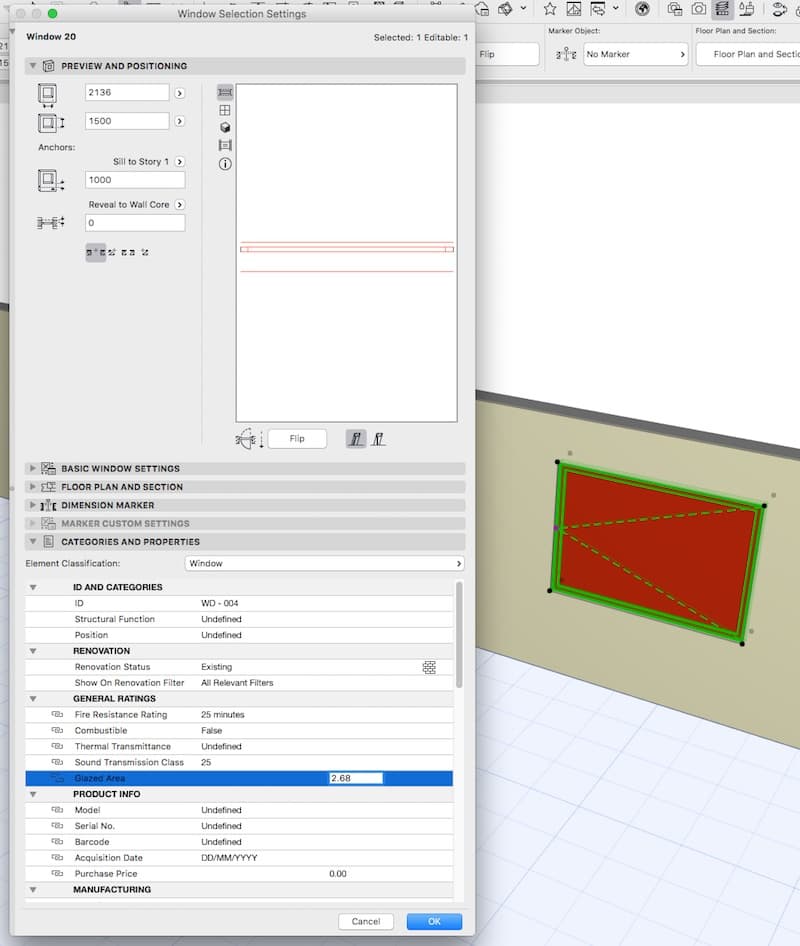
17 – The new Glazing Area property now appears in the Windows Settings dialog box where the user can input a number.
From within this same dialog, the Availability panel determines what elements get each property, as they are made accessible from, principally, the Settings dialogs for various elements in the program. (see lower section of image 16)
Beyond version 20’s new abilities with round-tripping data via Excel from tabular data defined via custom properties, version 20 also supports much-increased capacity with BIM interoperability. IFC 4 is supported in addition to IFC 2.x3. IFC 4 support includes new coordination workflows like Design Transfer View and Reference View. There is also COBie 2 export. And importantly, BCF (BIM Collaboration Format) is also robustly supported.
A Comment on Algorithmic Design
Architosh has already written the newish Rhino + Grasshopper + ARCHICAD Connector technology. This is not a traditional review article so there will be no big dive or review of those features here.
In speaking with the Rhino folks at McNeel in Seattle about a year ago, I was informed by Daniel Belcher that the Rhino folks were deeply impressed by the ARCHICAD team and their integration work with them. Since version 20, GLD (which stands for geometric description language and is based on BASIC) library parts can store the mathematical formula of NURBS elements imported from Rhino; thus, as Tibor Tszolnoki of GRAPHISOFT told me, the users have better control over the representation (eg: curve resolution) of the Rhino objects within the ARCHICAD model.
Considered a sidebar feature to version 20, the Rhino + Grasshopper + ARCHICAD Connector for ARCHICAD 20 is a powerful new capability. (image 17)

17 – The Rhino-Grasshopper-ARCHICAD connection is a bi-directional link between all three programs that brings algorithmic design deep into the BIM workflow.
What this new technology does is greatly improve the BIM leader’s strength in the earlier phases of the MacLeamy Curve, principally schematic design (SD). This isn’t an area that was ever weak for the Hungarian software BIM leader, but it squarely puts the BIM tool in great company as the most avant-garde architectural practices are routinely designing advanced forms in architecture using the market-leading algorithmic design and modeling duo—Rhino + Grasshopper.
Closing Comments
The new “fresh look”—as GRAPHISOFT likes to call it—is so much more than just a fresh look. The best parts of the new UI are really the user-experience (UX) aspects that come with it. The automatically resizing and expandable nature of the dialogs and palettes such that they don’t need scroll bars is not only highly functional but solves practical issues—like allowing precious screen real estate to be put to use elsewhere.
Digging into the graphic overrides functionalities revealed several aspects of this technology. Learning that GDL data isn’t yet available to the query against in graphical rules isn’t a big issue, per se, but the thought of what could come in the future sponsored deep curiosity. The new overrides technology enables a new way of thinking about data in BIM and how this data can reflect on knowledge capture and knowledge management. This could be an interesting new direction for the BIM innovator to explore.
Advertisement
The reason why I focused on the glazing area example above is due to my own recent architectural practice experience. In doing a project with over-sized glass I came to learn about who in the world (manufacturers) can actually make such large units and at what cost premiums. More importantly, I learned from several manufacturers that architects sometimes design buildings with glass spans that exceed common industry sized glazing units—forcing them to redesign often at the bidding stage. Oops! That’s not when an architect wants to revisit the design.
Let’s put this into a bigger perspective. Knowledge attainment in the larger sense in AEC comes principally via project experience. But how can such knowledge get captured and then embedded into the intelligence of the architect’s workflow? Graphic overrides and their rule sophistication seems to offer some suggestions; it is in the formulation of rules that go beyond graphically ‘highlighting’ things like doors that don’t meet handicap regulations and extend to other dimensions in practice, like manufacturing limits and aspects that step-up cost factors.
The three areas examined in detail above are core to ARCHICAD 20’s new advantages in the market. They lay some exciting groundwork—that GRAPHISOFT can continue to build upon—but the BIM market has many legs on which products stand on to provide value. ARCHICAD 20 features many other improvements, which many of its users have likely been enjoying worldwide now for at least six months if not longer.
GRAPHISOFT still battles a bigger foe in Autodesk in many large markets, especially North America, but it has consistently out-innovated everyone else in the market in getting to the front position in newer ideas, technology, and trends. No wonder some of the world’s most progressive and cutting-edge architecture practices have standardized around it. The new UI is so streamlined and “mobile app-like” it should appeal very much to next generation of architects. Yet for those experienced BIM-based architects today, ARCHICAD 20 puts a focus on information in BIM in a huge way, while providing a visual sandbox of tools (in Graphical Overrides) that bring this information to life. —-ANTHONY FRAUSTO-ROBLEDO, AIA, LEED AP.
SaveSave
SaveSave