Ciao, my name is Marcello Brocato and I have authored a series of Viewpoint contributions for Architosh that will showcase our new lighting design program for Mac OS X—Illuminando. We have already covered the Lesson 1 here, covering the very basics of light from the physics perspective. If you need to review the basics of light, go here now.
This is our first real in-depth lesson. We will start by leading the reader through our ‘Lighting School’ series by working on some basics in the Mac app Illuminando. Let us start with a simple room, which we will light. We will go through building the room, starting the lighting calculations and then preparing the report. You are welcome to learn more about Illuminando here and to download a trial version.
Let’s begin Lesson 2.
Building the Room
The first step consist in opening from the menu “File” the item “Room Wizard” that will open the standard dialog; let’s choose the room parameters and the surface color following the scheme at point 1: (see image 01 below)
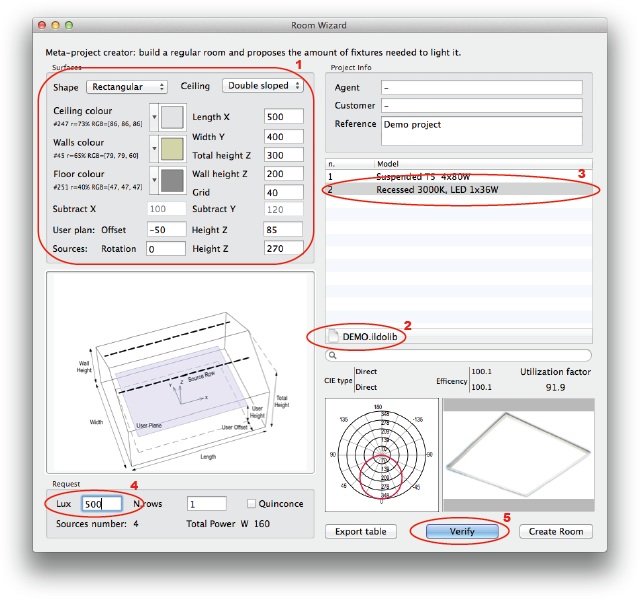
01 – Tutorial image showing the Room Wizard in Mac OS X app Illuminando.
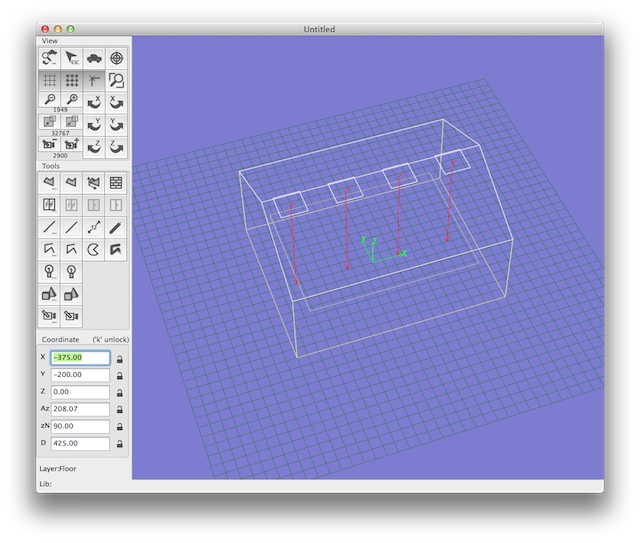
02 – The room we just created in 3D view in Illuminando.
Then navigate in the “Luminaires” folder to choose “DEMO.ildolib” catalogue (point 2) in which select the “Recessed 3000K, LED 1x36W” luminaire (point 3). In the “Lux” edit fIeld everything is ok, press the “Create room” button and the Application will build the room to start calculations. (see image 02)
Starting the Calculation
Select in the menu “Lighting” the item “Calcul…”, erase the content of the “Number of multiple reflections” edit field, include in calculation only “Source and Showcase at precision” – “Low” and then pushing the button “Ok” the software will compute the direct lighting calculation. To examine the results at this first step, select the user surface (as You can see in figure 02) and choose the menu “Lighting”->”Results”.
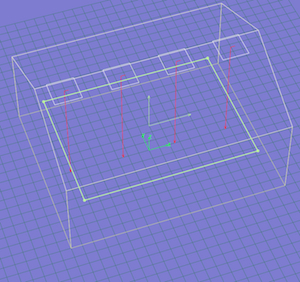
Zooming to a scale of 1/20 (menu “View” “Zoom scale” “1/20”), typing 500 in the “Saturation val.” edit field and choosing “Colour Map” + “Curve Map” + “Autoscale”, You will see the following view: (see image 03)
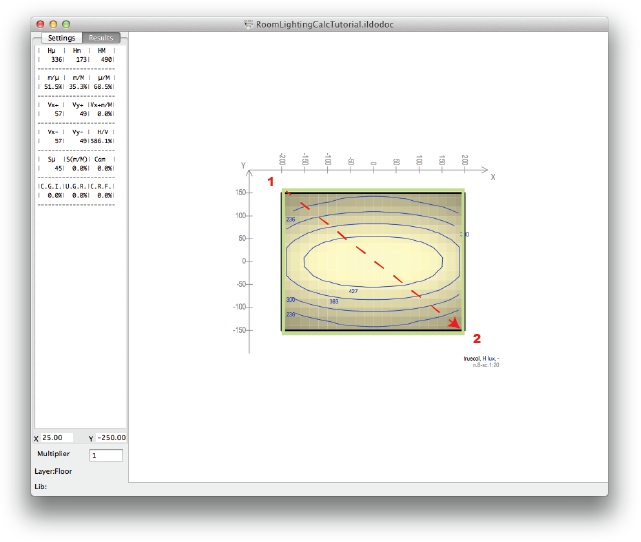
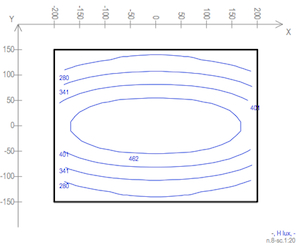
03 (06) – Tutorial image of Illuminando showing the results of a lighting calculation with a basic room configured earlier.
In which is presented the flat surface n.8 in true color and isolux curves. You can change the show results mode in some other way through the drawer settings.
Opening with the mouse a rectangle inside the surface or simply making a click somewhere, the partial result values will be presented: opening a rectangle from the top-left corner (1) to the bottom-right one (2) of the projected surface (as you can see in image 03) the information on the whole surface will be presented, and in the left drawer You will see the values relative to the selected zone.
Then we can go on in multiple reflections: choose “Lighting”->”Calcul…” from the menu and put ‘4’ in the “Number of multiple reflection” edit field and start the calculation once again. Close the dialog at the end of calculation, and let’s examine again the result: select the user surface and select the menu “Lighting” “Results”. Open a rectangle that include the whole surface (the same procedure of figure 3), read the results and see that the horizontal illuminament has rised to 377 lux.
You can go on in multiple reflections or stop calculation accepting the results.
Preparing the Report
For this, we have to choose the picture we want to show in the first page (menu “View”->”Save Image for Report as ‘Cover design'”), in the “Installation of the fixtures” paragraph (menu “View”->”Save Image for Report as ‘Layout design'”) and in the “Result on worktop” paragraph (menu “View”->”Save Image for Report as ‘Result design'”). The procedure is simple.
To export the ‘Result design’ picture we have to select for first the surface whose results we want to represent and then all the elements we want to project on it: then choose the “Lighting”->”Result” menu, and finally select the visualization option we want to view in the report page:
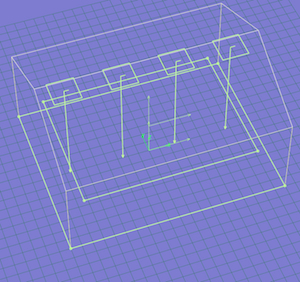
The user surface selection and calculation results on it. (see images 04 – 05)
04 (12) – Our basic test room for lighting, image chosen for report.
05 (13) – Another lighting results image chosen for report.
To save in the ‘Result design’ picture-slot select the menu command ‘View’->’Save Image for Report as Result design’. Come back to the 3D general view by selecting “Lighting”->”Result” menu again.
To export the ‘Layout design’ we have to select for first the surface we want to use as reference plan and then all the elements we want to project on it to create an installation layout. Follows an example in which the view is plotted in black+red+white (managing from the left drawer). Then choose the “View”->”Plan View” menu and adjust the view by centering and zooming (better in scale) it. (see image 06 – 07)
07 (14) – Tutorial image.
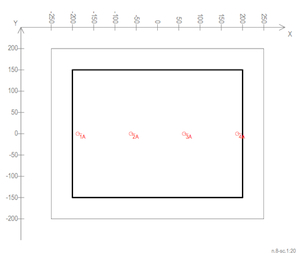
08 (15) – Tutorial image.
To save in the ‘Layout design’ picture-slot select the menu command ‘View’>’Save Image for Report as Layout design’. Come back to the 3D general view by selecting “View”->”Plan View” menu again.
To export the ‘Cover design’ simply adjust the last 3D general view to your preferences. In the following picture the view is plotted in black+red+white and the 3D-model linking on.
To save in the ‘Cover design’ picture-slot select the menu command ‘View’->’Save Image for Report as Cover design’. Then select the “File”->”Export” menu and set your preferences. Pressing the “Ok” button the software will ask to save the report file: select “Rich Text Format” or “Rich Text Format Directory” in the pop-menu and choose among the exportation preferences.
Then let’s open the saved file to add some picture in. (see image 09 below)
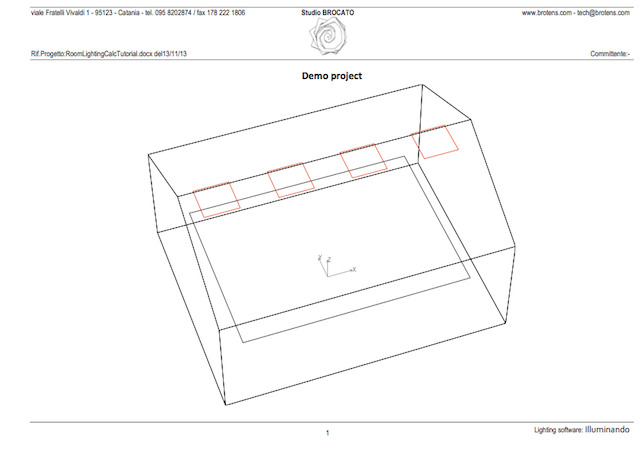
09 (17) – The subject room located into the report.
If “Rich Text Format” was choosen, the first operation is to unlink the images referenced in the document and then save the file in a native format.
Then, scroll the document to see if each picture is contained in the relative page (it is possible to resize them) and to update fields (the table with the Product List at the end of document contains some formulas: it is possible to view and modify them with specific commands inside each word processor).
Now we can paste into the document some rendered image. Come to the application and, from the 3D general view, select the command “View”->”Rendering”: you’ll see something like this: (image 10 below)
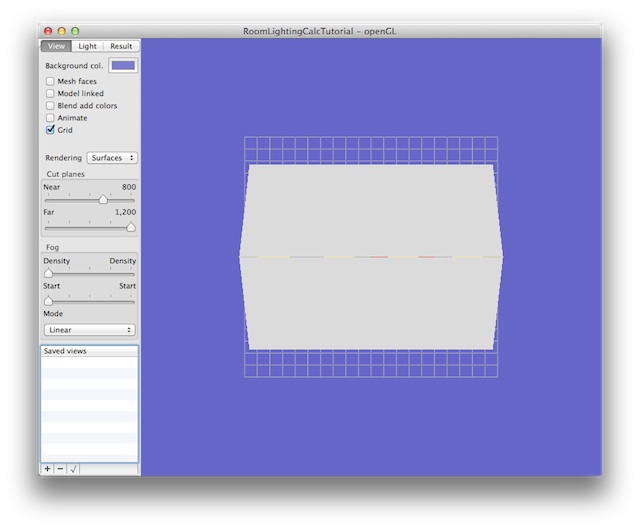
10 (23) – A rendered view from the outside of the room. One needs to use the ‘cut plane’ to see into the room and see the lighting results.
Now with the ‘Virtual sphere’ mouse-method rotate (click-drag procedure), zoom (mouse wheel) and drag (right-button + click-drag procedure) the view, then bring the Near “Cut plane” to a such position to make the view similar to the one presented in the next figure: (see image 11 below)
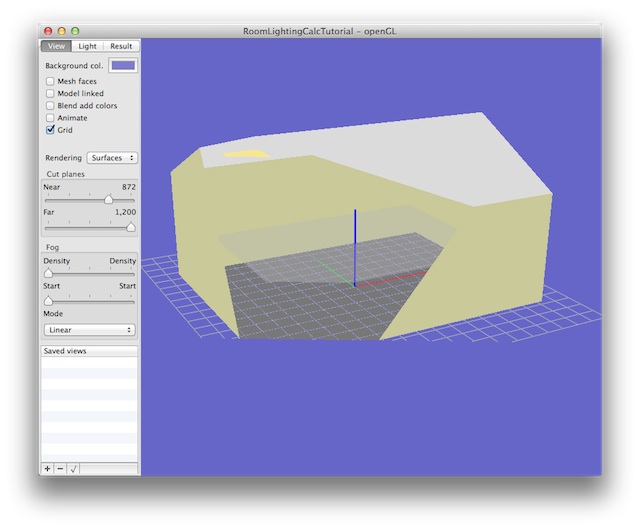
11 – (24) – View showing cut plane position so that you can see into the room.
Save the view with the + button down in the drawer. Now enable ‘Mesh faces’, disable the ‘Grid’, activate the Light tab controlling that the support lights follow the next picture and try to enter the room: (see image 12)
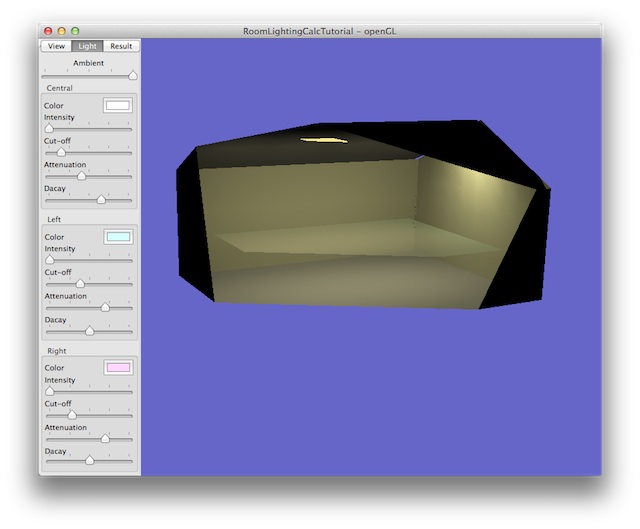
12 – (25) – OpenGL based rendering of room with lighting shown.
Now copy the image in the clipboard and go to page 4 of the report. Put the insertion point after the image, press Return, type “RENDERING”, press Return again, then paste the clipboard content and eventually resize it to fit in the page. Activate the Result tab and adjust the “Saturation” at the value of 300 lux and activate the “False Colours” commands, to see the following imagine. (see image 27 below)
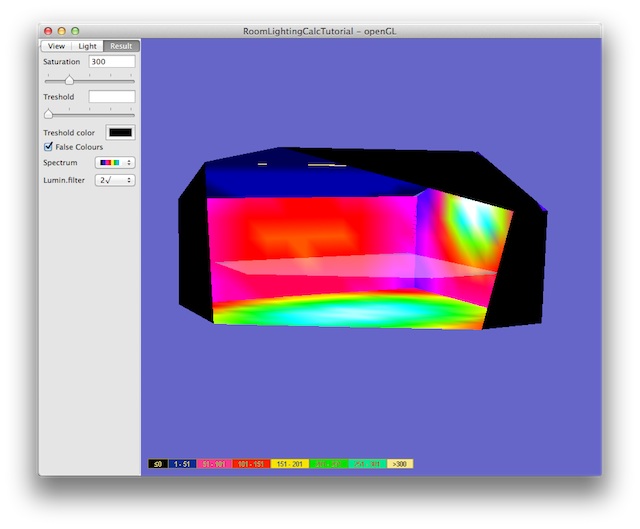
13 – (27) – OpenGL rendered view showing lighting data in False Colours command.
Copy the image in the clipboard and go to page 5 of the report. Put the insertion point after the image pasted before, press Return and paste the clipboard content.
Save the file and this is all!
To learn more about Illuminando by Brotens of Italy, please visit our website where you can learn all about our Mac OS X lighting design software applications. We hope to have more lessons in this Lighting School series published soon here on Architosh.
Ciao!

Reader Comments
#CAD Viewpoint: Lighting School with Mac App Illuminando Lesson 2 http://t.co/qkh6hYnv21
#CAD Viewpoint: Lighting School with Mac App Illuminando Lesson 2 http://t.co/qkh6hYnv21
John Hupp liked this on Facebook.
John Hupp liked this on Facebook.
Comments are closed.